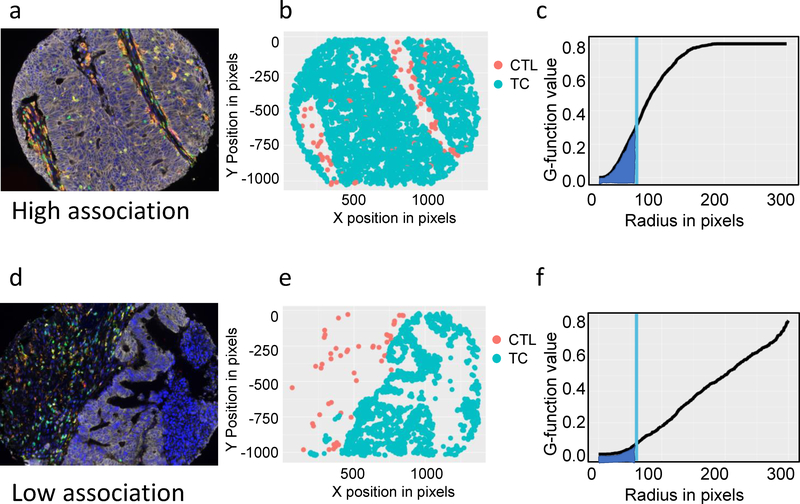
Figure 1: G-function mathematically models CTL-TC mixing.
(1a) Multiplex fluorescent immunohistochemical composite image of a highly mixed CTL-TC tumor: TC (white), T cells (green), Tregs (green and red), CTLs (yellow), APCs (orange), PD-L1 (magenta), and DAPI (blue); (1b) spatial phenotype map of PDL1−TCs (blue) and CTLs (red) provides two-dimensional cellular location; (1c) Spatial data is used to calculate the G-function (line), a mathematical representation of cellular mixing. Measurement of the area under the curve (AUC) at a fixed radius (blue) allows for comparisons of the rate of rise of the G-function. Representative example of a tumor with low CTL-TC mixing is shown (1d-f).

