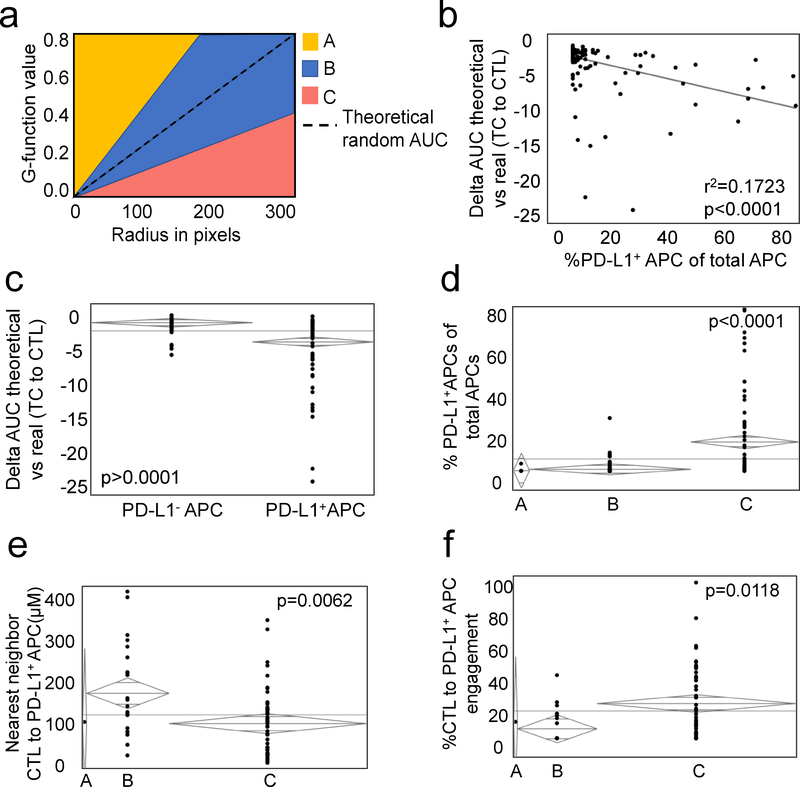
Figure 4: Differences between measured and predicted G-function highlight the importance of PD-L1+ APCs in the TME.
(1a) A theoretical random G-function (dotted line) was calculated for each patient. Those with a measured G-function within one standard deviation of the theoretical random (blue shading, group B) were deemed to have a random degree for CTL-TC mixing. Those with a G-function one standard deviation greater than (shaded yellow, group A) or less than (shaded red, group C) the theoretical random were determined to have non-random CTL-TC mixing and non-random CTL-TC non-mixing, respectively. Bivariate analysis (1b) ANOVA (1c) revealed a close correlation between the delta theoretical random vs measured G-function AUC (dTvR) and ratio of PD-L1+ APCs of total APCs. Examination of the individual cohorts revealed a greater proportion PD-L1+ APCs in those with non-random CTL-TC non-mixing with associated decreased intercellular distance (1e) and engagement with CTLs (1f).

