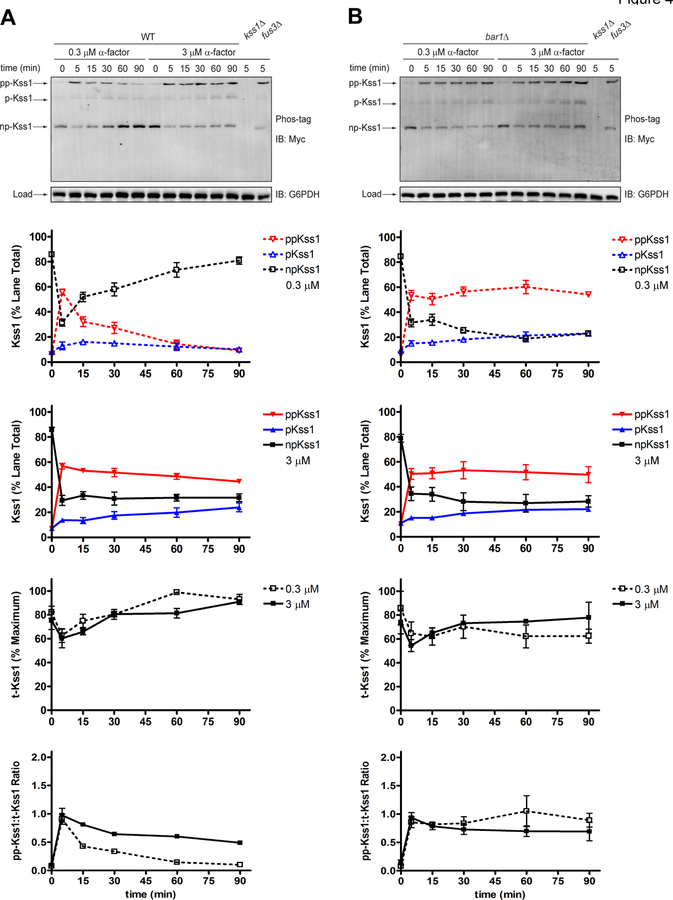
Figure A2. Phosphorylation of Kss1-Myc by Phos-tag SDS-PAGE and immunoblotting with Myc-Tag antibodies.
Phos-tag western blot analysis of (A) wild-type cells or (B) bar1Δ cells treated with 0.3 μM or 3 μM α-factor mating pheromone and probed with anti-Myc tag antibodies to identify dually phosphorylated (pp-Kss1), mono-phosphorylated (p-Kss1), and non-phosphorylated (Kss1) Kss1. pp-Kss1, p-Kss1, and np-Kss1 (first and second graphs) are plotted as % of lane total. Total Kss1 (third graphs) is plotted as % maximum lane signal on the blot. The ratio of dually phosphorylated Kss1 to total Kss1 (bottom graphs) was calculated by dividing the % dually phosphorylated Kss1 in each lane by % total Kss1 in each lane. Data are presented as mean ± standard deviation, N = 3.

