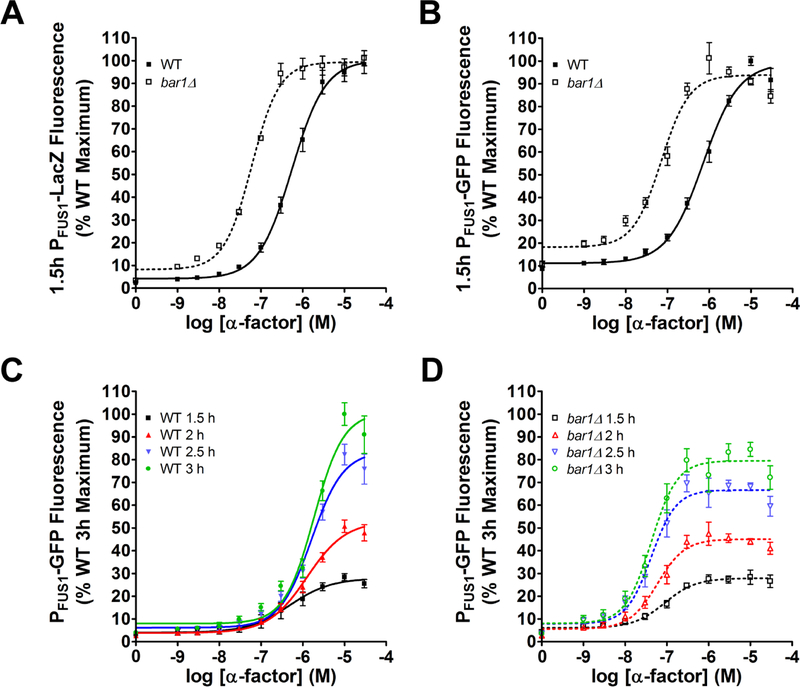
Figure 4. Pheromone-induced gene transcription assays.
Dose-response curves for transcriptional output of wild-type and bar1Δ cells after 1.5 hours of treatment with α-factor mating pheromone, obtained by (a) the PFUS1-LacZ and (b) the PFUS1-GFP reporters. Time course of PFUS1-GFP response in (c) wild-type cells and (d) bar1Δ cells. Data are presented as mean ± standard deviation, N = 4.

