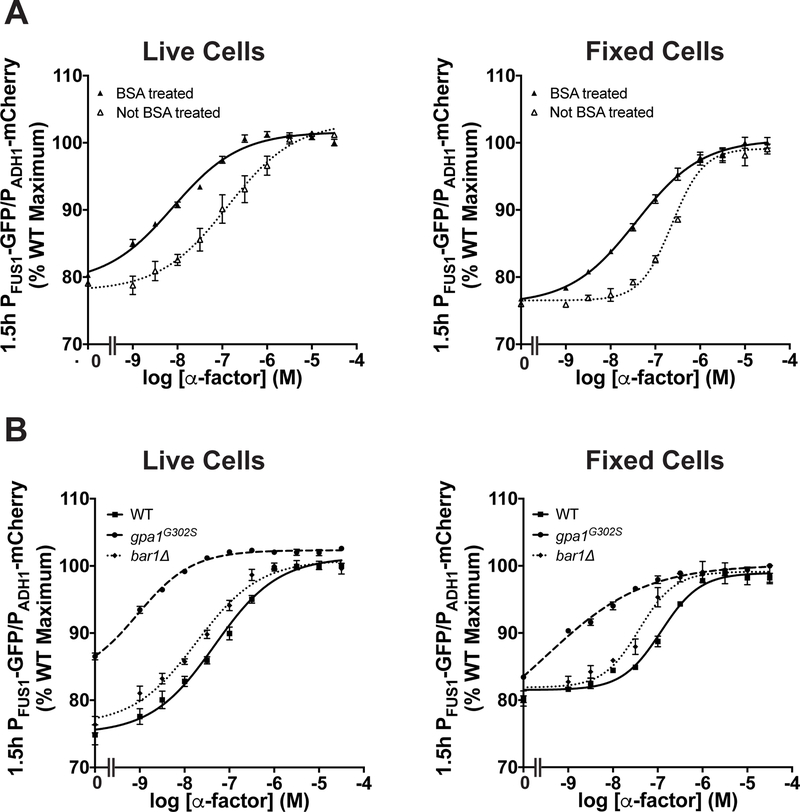
Figure 5. Flow cytometry transcription assays.
Cells gated based on forward scatter, side scatter and fluorescence (see Figure A3, a–c) were used for (a) dose-response experiments done with wild-type cells in wells that were either untreated or coated with BSA and analyzed either immediately (live cells) or after chemical fixation. (b) Dose-response experiments done with wild-type, gpa1G302S, and bar1Δ cells in BSA-coated wells were analyzed immediately or after chemical fixation. Data were fitted using the sigmoidal dose-response in Prism (GraphPad). Data are presented as mean ± standard deviation, N = 4.

