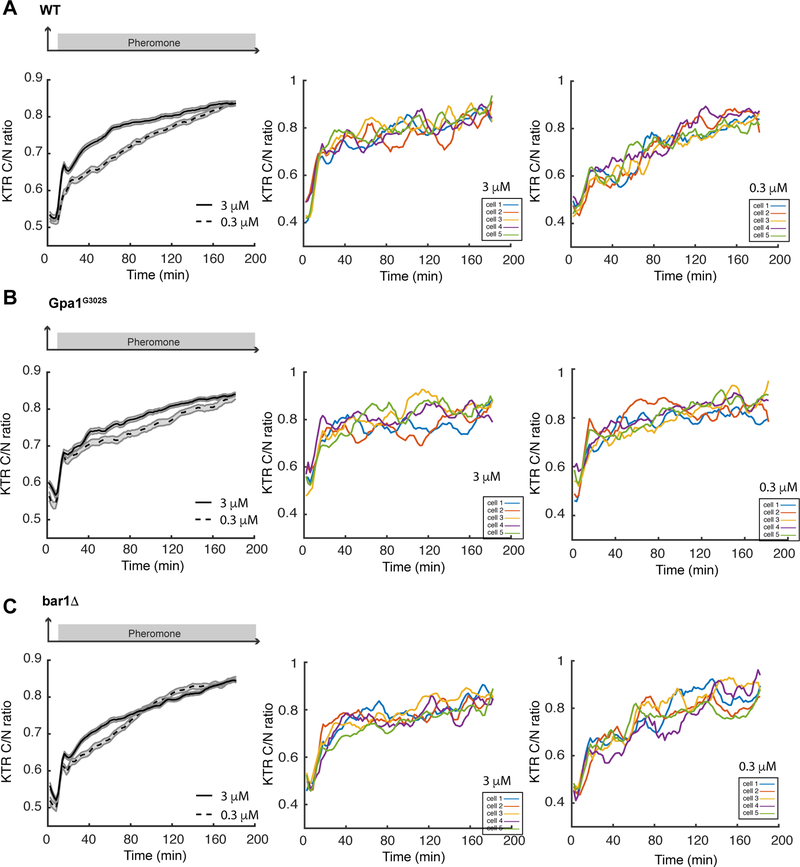
Figure 8. Kinase translocation reporter for Fus3 activity.
Time traces of reporter responses to 3 μM (solid line) and 0.3 μM pheromone (dashed line) are shown for (a) wild-type, (b) gpa1G302S, and (c) bar1Δ. Shaded areas represent S.E. Representative single cell time traces of Fus3 activation are shown for cells treated with 3 μM and 0.3 μM pheromone. The reporter response was quantified as cytoplasmic over nuclear fluorescence intensities (C/N ratio).

