Figure 4.
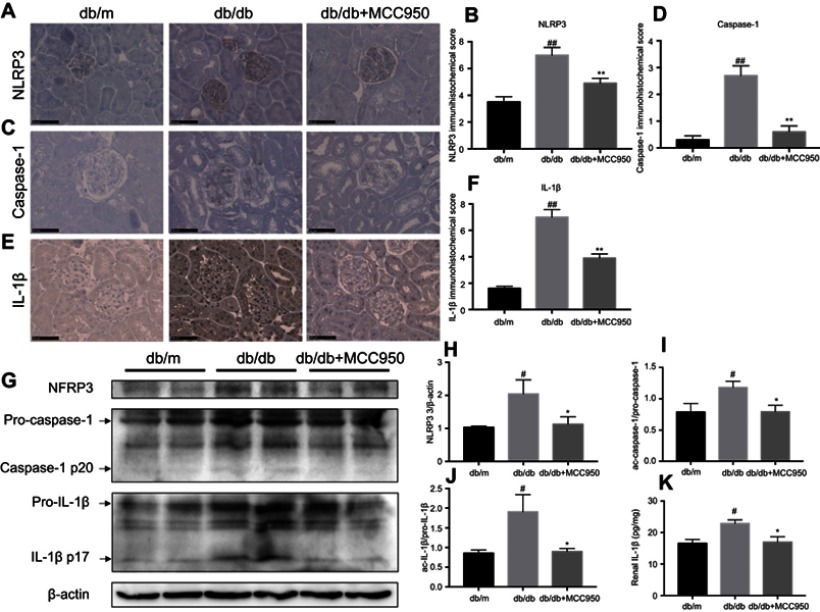
MCC950 inhibited diabetes-induced renal NLRP3 inflammasome activation in db/db mice.
Notes: (A–F) Representative immunohistochemical images and immunohistochemical scores of renal sections for NLRP3, caspase-1 and IL-1β staining in renal cortical tissue from db/m, db/db and db/db+MCC950 groups at 20 weeks of age. Bar =50 μm. (G–J) Western blot analysis of NLRP3, caspase-1 and IL-1β in renal cortical tissue. (K) Expression of IL-1β in renal cortical tissue at 20 weeks of age by ELISA (F=6.331). Data represent means ± SEM (n=10). #P<0.05 and ##P<0.01 versus db/m mice; *P<0.05 and **P<0.01 versus db/db mice.
Abbreviations: NLRP3, NOD-like receptor pyrin domain-containing protein 3; SEM, standard error of mean.

