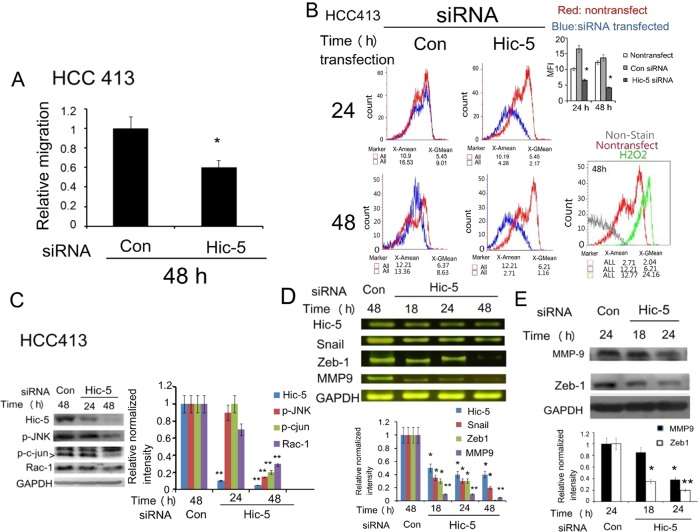
Fig. 1. Depletion of Hic-5 suppressed ROS generation, phosphorylation of JNK/c-jun and expression of Rac-1, Snail, and Zeb-1 and cell migration.
HCC413 were untransfected (non) or transfected with Control (Con) or Hic-5 siRNA for indicated time. Transwell migration (a) DCF-DA ROS generation assays (b), western blot of indicated molecules (c) and (d) and RT/PCR of indicated molecules (d) were performed. In (a), relative migration was calculated as the ratio of the intensity (scanned by ImageJ software) of migrated cells from that transfected with Hic-5 vs that with control (Con), taking the data of control as 1.0. In (b), curve plots overlaying non-transfected (red curves) and control siRNA or Hic-5 siRNA- transfected groups (blue curves) are shown with the mean fluorescence intensity (MFI) values below (left panel). Quantitative histogram of MFI for comparison of control siRNA and Hic-5 siRNA at each time point was shown in the right higher panel. (*) represent the statistically significant difference (p < 0.05) between Hic-5 siRNA and control siRNA group. In the right lower panel of (b), the curves of unstained cell and H2O2-treated cell (48 h) overlapping with that of untreated cell are shown as negative and positive controls, respectively. In (c), (d) and (e), the quantitative figures were shown in right (c) or lower (d) and (e) panel. The intensity of each molecule was normalized with GAPDH. Relatively normalized intensity was calculated taking the data of control siRNA (Con si) group as 1.0. Each data was average of five reproducible experiments with coefficient of variation (C.V.) 9.5%. (**, *) represent the statistically significant difference (p < 0.005, p < 0.05, respectively) between the indicated Hic-5 siRNA with control siRNA group of the indicated molecules

