Figure 4.

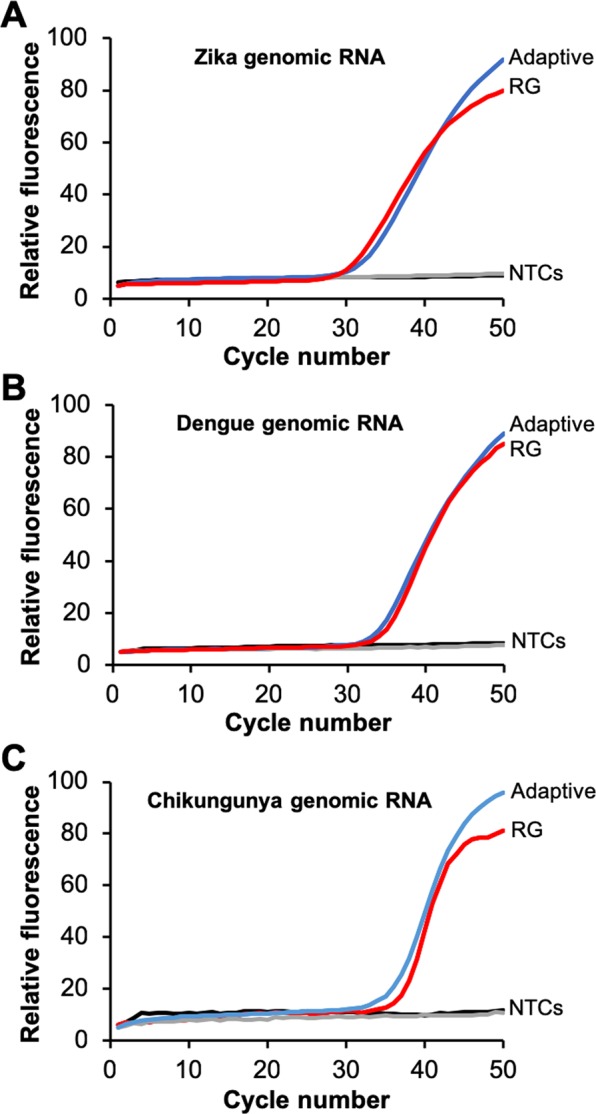
Comparison of amplification curves of 500 copies/reaction and 0 copies/reaction (NTC) of genomic viral RNA using Adaptive RT-PCR (blue) and standard RT-PCR (red) on a Qiagen RotorGene Q instrument for Zika (A), dengue (B), and chikungunya (C) virus. Each assay contains the same reaction mixture including all three primer and probe sets and L-DNA probes. Each amplification curve is the average of three independent runs. Individual runs are shown in Supplementary Fig. 2.
