
Figure 6.
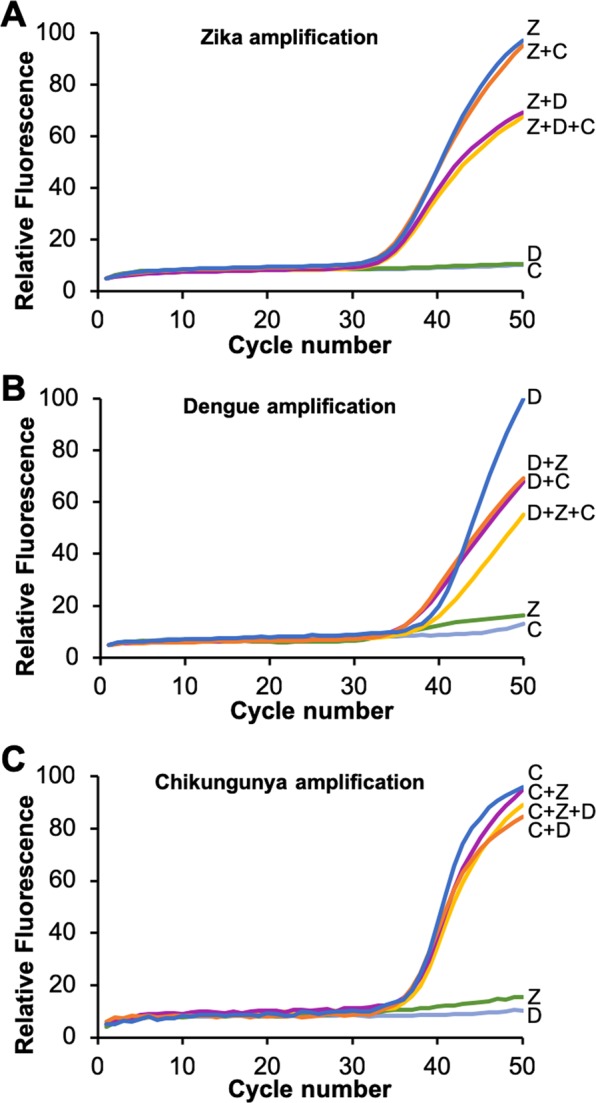
Adaptive RT-PCR amplification curves of 500 copies of Zika (A), dengue (B), and chikungunya (C) genomic RNA alone (blue curves), with 500 copies of genomic RNA from another virus present (magenta and orange curves), and with 500 copies of genomic RNA from both other viruses present (yellow curve). Amplification curves with non-target RNAs added (green and grey) are also included. Each assay contains the same reaction mixture including all three primer and probe sets and L-DNA probes. Each amplification curve is the average of three independent runs.