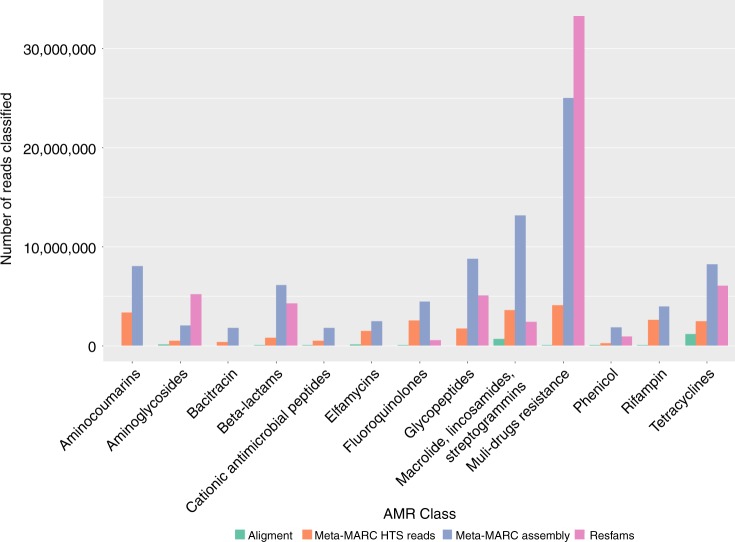
Fig. 4.
Comparison between the average number of variations between a read and consensus sequence (contig or reference). Counts of the non-major allele were determined for each genomic position by method and summed by AMR class category and sample. The median value for the methods utilizing assembly and alignment was ~7 variations per read on average. We note that the assembly methods also utilized alignment to map the DNA sequence reads back to the consensus contigs, which contributed to the reduction in allowed variation. The median value for Meta-MARC HTS was threefold higher than competing methods. Meta-MARC HTS was significantly different (***P < 0.001) compared to every other method via a Wilcoxon rank-sum test, corrected for multiple testing by the Bonferroni method. The Wilcoxon rank-sum test was performed using 1891 independent Class-level node and sample combinations per group tested

