Fig. 4.
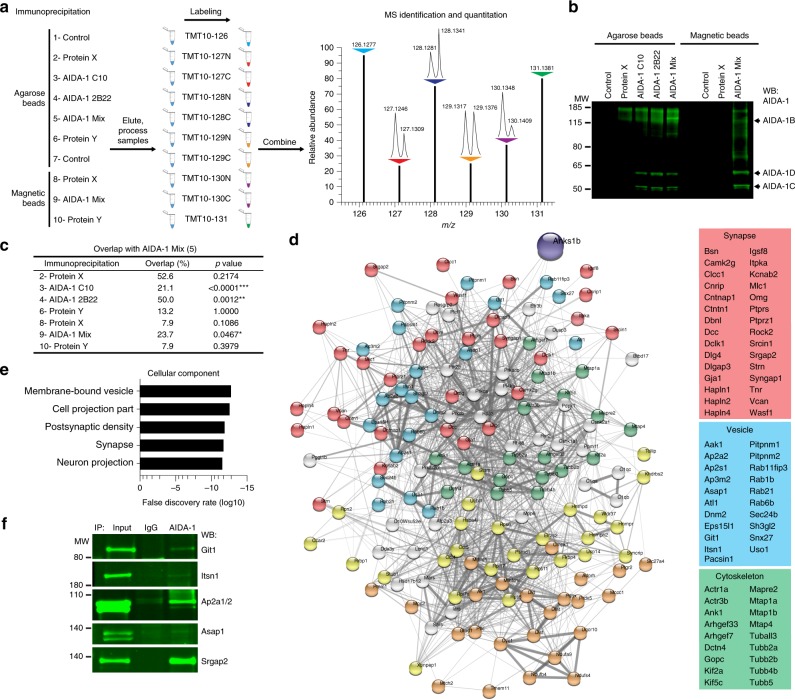
Identification of the AIDA-1 interactome by mass spectrometry reveals novel cellular roles. a Ten immunoprecipitations (IPs), including four IPs using different AIDA-1 antibodies (C-10, 2B22, or Mix) and beads (agarose or magnetic), two control IPs using mouse IgG, and four control IPs of unrelated synaptic proteins. Samples were differentially labeled using isobaric tags and mixed for MS analysis. Peptides bearing each isobaric tag were simultaneously identified and quantified. b Western blots showing AIDA-1 isoforms immunoprecipitated by AIDA-1 antibody combinations. Only antibody 1A11 (included in AIDA-1 Mix) was able to pull down AIDA-1B. c Overlap of interactors from the AIDA-1 Mix Agarose sample was significant only with interactors from other AIDA-1 IPs by two-sided Fisher’s exact test, *p < 0.05, **p < 0.01, ***p < 0.001. d Depiction of the AIDA-1 interactome prominently featuring components of the synaptic compartment, membrane-bound vesicles, and cytoskeletal projections. (Yellow = ribosome and proteasome; Orange = mitochondria). e Top gene ontology (GO) terms for cellular components enriched in the AIDA-1 interactome. f Co-IP of novel AIDA-1 interactors from mouse brain lysates. Git1 = 84 kDa, Itsn1 = 195 kDa, Ap2a1/2 = 108/104 kDa, Asap1 = 125 kDa, Srgap2 = 121 kDa

