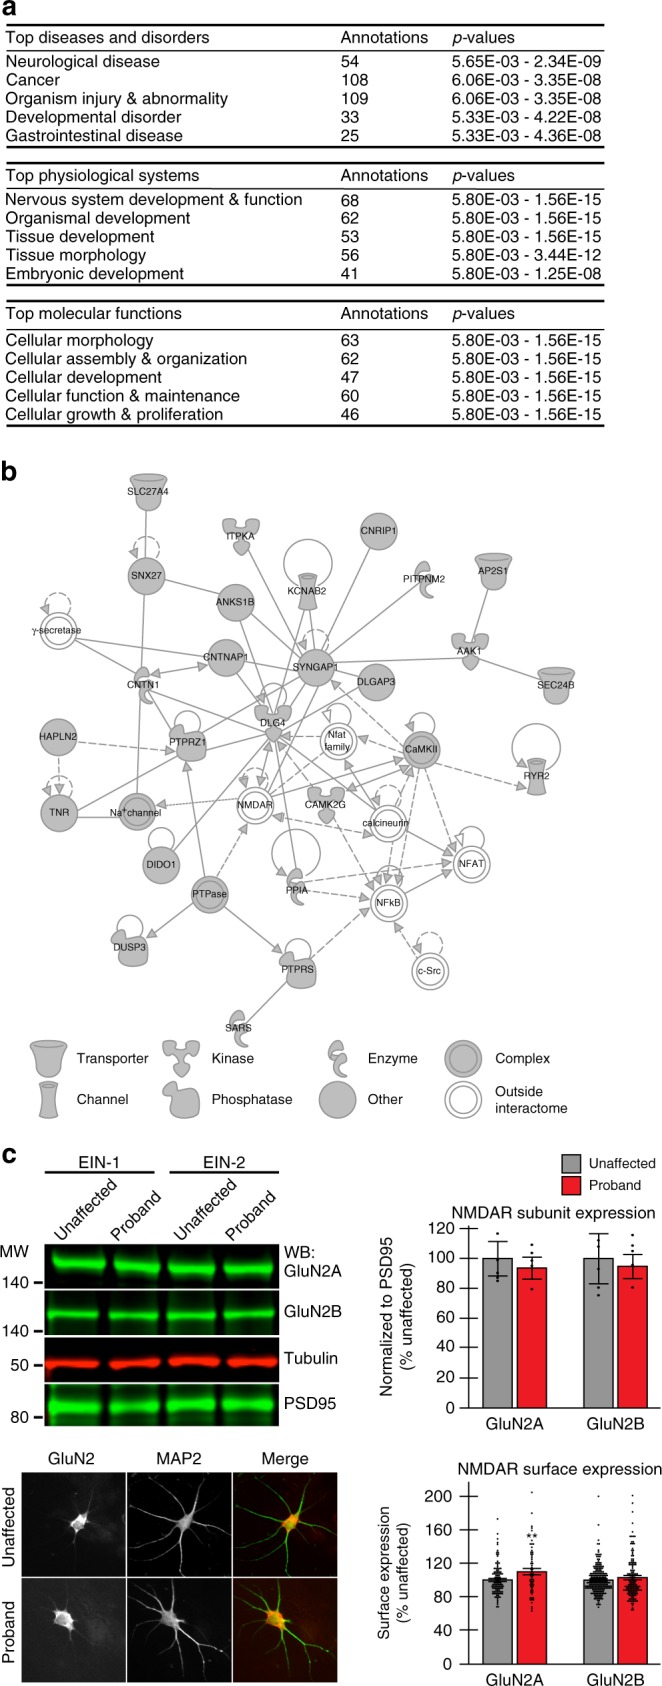
Fig. 5.

Analysis of the AIDA-1 interactome yields functional pathways and mechanisms of disease. a Hierarchical analysis of the most significant diseases and functions in IPA reveals the top disorders, physiological systems, and cellular processes regulated by the AIDA-1 interactome (p-values are given as a range for the diseases and functions annotated in each category). b The top network identified using Ingenuity Pathway Analysis (IPA) revealed known interactors and novel pathways associated with AIDA-1 (network score = 49, number of focus molecules = 25). Solid lines = direct interaction, dashed lines = indirect interaction, filled arrows = activation, open arrows = translocation, dash = inhibition. c (Top) Western blot (Family EIN-1 and EIN-2) and quantitation (Family EIN-2) of NMDAR subunits GluN2A and GluN2B in iPSC-derived neurons show no changes in probands (10 μg lysate). N = 3 biological replicates. (Bottom) Sample images (GluN2B) and quantitation of GluN2A and GluN2B surface expression in neurons from proband EIN-2-1 and unaffected mother EIN-2-M reveal a significant increase in GluN2A, but no change in GluN2B. N = 3 biological replicates based on 60–99 neurons. Scale bar = 10 μm. Bar graphs show mean ± SEM, two-sided Student’s t-test, *p < 0.05, **p < 0.01
