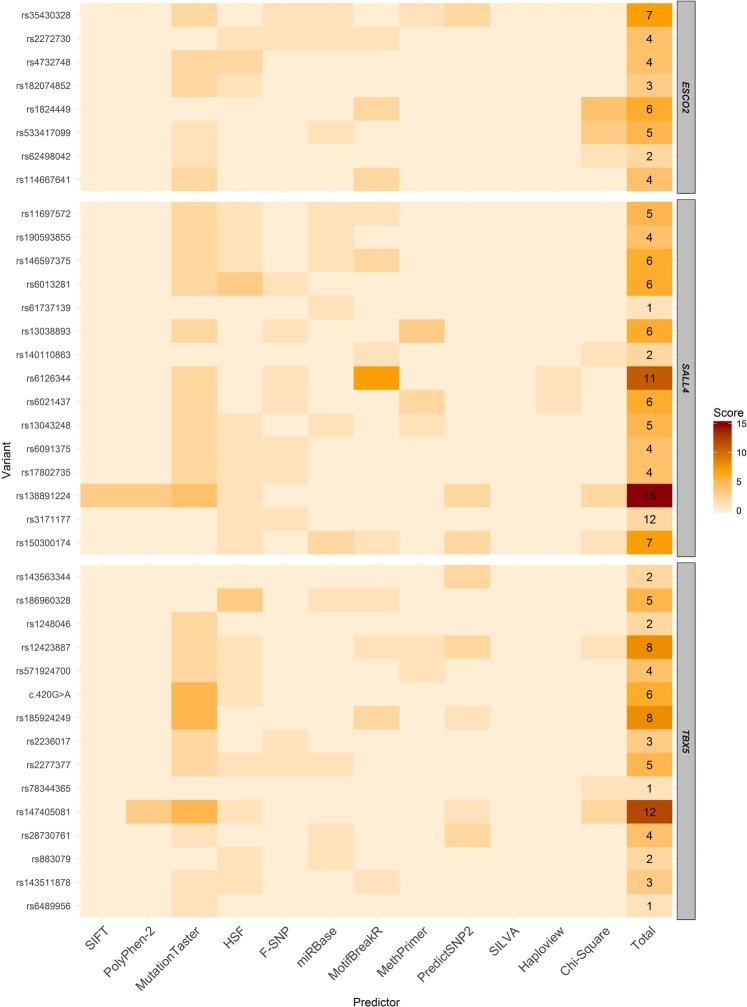
Figure 2.
Heatmap representing the potential impact of variants found in ESCO2, SALL4 and TBX5 genes in regulatory features of these genes, their proteins and in TE. In the lines are represented the variants, the scores assigned to them after functional predictions and the final score. The scores are presented by color tone variation; the higher the points the darker the color; the lower the points the lighter the color. Regarding the columns, the first ten represent variant effect prediction tools, the eleventh represents the formation of haplotypic blocks and the twelfth represents the statistically significant difference of some variant with the genomic databases. The variant effect prediction tools pointed out variants which altered the features evaluated by the tool, being the impact of lesser or greater degree. To haplotypic blocks, it received a point variants that formed block. Variants with a statistically significant difference of allelic frequencies between the TE sample and the databases were pointed out, being greater the score of variants which differed from more than one database.

