Fig. 2.
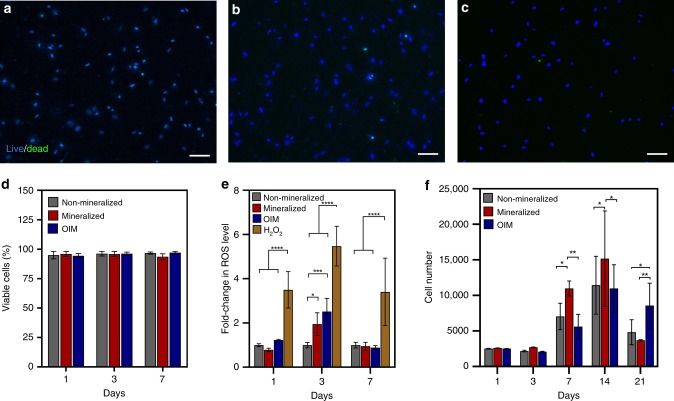
Cytocompatibility of the biomineralization process. Representative fluorescent micrographs of live (blue) and dead (green) stained hMSCs embedded in (a) non-mineralized, (b) mineralized, and (c) OIM-treated hydrogels after 7 days. Scale bar: 100 µm. d All groups showed more than 90% cell viability on days 1, 3, and 7, irrespective of the treatment method. Data are represented as mean ± SD (N = 6). e Mineralization of cell-laden hydrogels resulted in nonsignificant generation of reactive oxygen species (ROS) compared with H2O2 (*p < 0.05 and ****p < 0.0001, ANOVA/Tukey) after 7 days (N = 6). f Proliferation rate of hMSCs encapsulated in mineralized hydrogels was comparable to that of cells embedded in non-mineralized and OIM-treated hydrogels up to day 3 and was significantly higher than both groups on days 7 and 14 (*p < 0.05, **p < 0.01, ANOVA/Tukey). After 21 days, a sharp decrease in cell number was recorded in all groups, with a significant reduction observed in non-mineralized (*p < 0.05 ANOVA/Tukey) and mineralized (**p < 0.01 ANOVA/Tukey) hydrogels in comparison with OIM-treated samples (N = 6). Source data are provided as a Source Data file

