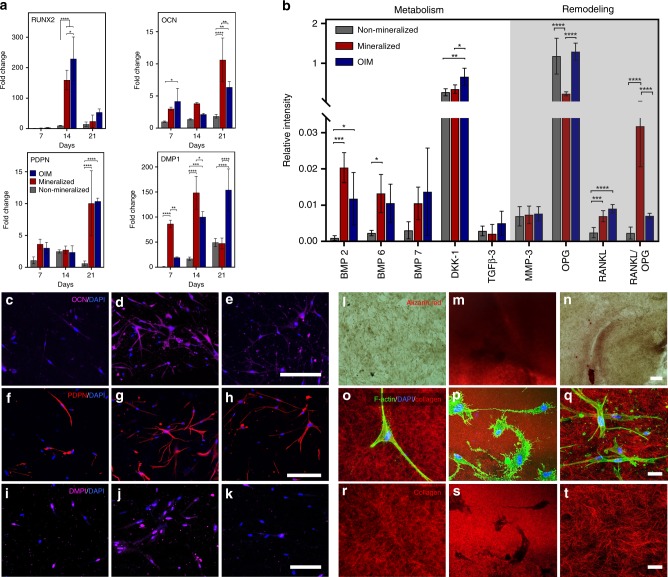
Fig. 3.
Osteogenic lineage commitment, gene, and protein expression in mineralized cell-laden collagen. a Gene expression of osteocalcin (OCN) was significantly higher (**p < 0.01) in mineralized collagen than in OIM treated, both of which were much higher than non-mineralized samples (****p < 0.0001), after 21 days. Expression of osteocyte-related genes (DMP1 and PDPN) was also comparable to OIM after 21 days of culture in mineralized collagen and significantly higher at earlier time points (DMP1, **p < 0.01 after 7 days and *p < 0.05 after 14 days). Data are represented as mean ± SD (N = 3). b A significant increase in the expression of BMP-2 and BMP-6 for cells in both mineralized collagen and in OIM relative to non-mineralized controls is consistent with enhanced bone-specific metabolic activity. A marked increase in the ratio of RANKL/OPG in mineralized samples, however, suggests the stronger potency for cell-mediated bone remodeling via a paracrine signaling in cell-laden mineralized constructs than in the other groups. (N = 4 for BMPs and N = 5 for others). At a cell-surface level, the expression of OCN and PDPN on day 14 was very low in (c, f) non-mineralized controls and significantly higher for both (d, g) mineralized and (e, h) OIM-treated samples (**p < 0.01, ***p < 0.001) (N = 3). Similarly, surface expression of DMP1 was comparable for (k) OIM-treated cells (****p < 0.0001) and (j) mineralized collagen (*p < 0.05), both of which were significantly higher than (i) non-mineralized controls (N = 4). Scale bar: 200 μm. Alizarin red staining to assay mineralization shows homogeneous and intense red staining even after 7 days in (m) mineralized constructs, whereas staining was more diffuse in (n) OIM-treated samples and almost non-existent in (l) non-mineralized controls. Scale bar: 100 μm. Reflectance confocal microscopy images of F-Actin/DAPI-stained hMSCs in (o) non-mineralized, (p) mineralized, and (q) OIM treated cell-laden collagen, illustrate the dendritic-like extensions of cells after matrix mineralization, reminiscent of osteocyte-like morphology. The above images, with cells digitally removed (r–t), show formation of well-defined lacunae-like regions in the locations where cells resided in mineralized matrix (s). Scale bar: 30 μm. Quantification of dendrite-like projections is shown in Supplementary Fig. 15. All comparisons used ANOVA/Tukey. Source data are provided as a Source Data file

