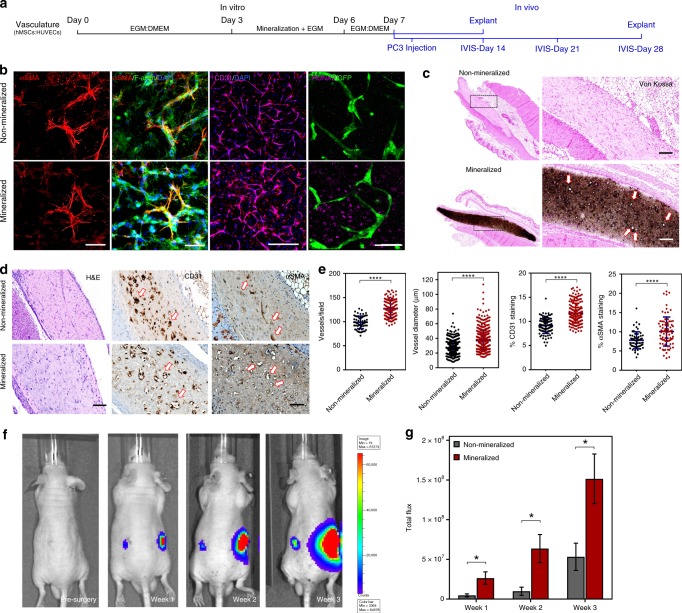
Fig. 6.
Vascularization of mineralized cell-laden collagen and interaction with prostate cancer cells. a Timeline for culture and implantation in SCID mice. b HUVECs formed endothelial networks that were supported by αSMA-expressing hMSCs (scale bar: 50 µm) and were also positive for CD31 (scale bar: 400 µm). The remainder of hMSCs expressed RUNX2 as a marker for osteogenic differentiation (scale bar: 50 µm). c Von Kossa staining of the non-mineralized (top) vs. mineralized tissue sections (bottom) after 7 days of in-vitro culture and 7 days of implantation. The dark/brown staining indicates calcification. Higher-magnification images (right) show luminal structures (arrows) consistent with microvessel formation within the calcified construct. d H&E images depict the collagenous matrix populated with cells. Anti-human CD31 antibody staining (middle) suggests the formation of endothelial networks by the transplanted HUVECs as opposed to murine vasculature infiltration. Vessels in non-mineralized sections had constricted lumens (arrows), as opposed to wider HUVEC-lined vessel structures in the mineralized construct (arrows). Anti-αSMA staining (right) shows fewer αSMA+ cells in the non-mineralized sections than in mineralized constructs, which appear to be wrapped by pericyte-like cells. e Quantification of vessel number and diameter indicate robust vascularization and cell survival in mineralized groups, compared with their non-mineralized controls. Quantitative analysis of % area of CD31 and αSMA immunostaining suggests an increased vascularization and vessel stability in mineralized constructs. Data presented as Mean ± SD (N = 3) (****p < 0.0001 Student’s t-test). f Representative bioluminescence images captured before and once a week until 3 weeks, after injection of PC3/Luc cells as visualized by IVIS. g A significantly higher bioluminescence signal intensity was detected in the region implanted with mineralized construct compared with the non-mineralized control. Data presented as Mean ± SEM (two-tailed Student’s t-test, *p < 0.05; n = 8 for non-mineralized groups; n = 12 for mineralized groups from two-independent experiments)

