Fig. 1.
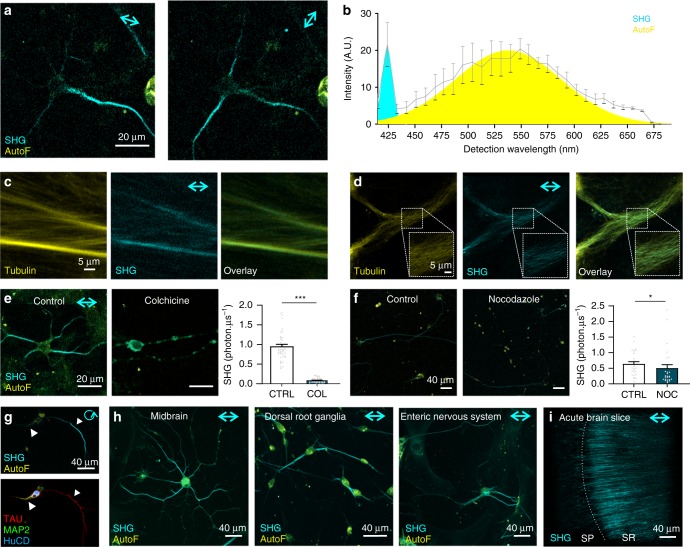
SH generation to image microtubules polymerized in vitro, in cell culture and brain slices. a–f Confirmation of the microtubular origin of the SH signals. Laser polarization direction is indicated with a double (linear) or circular arrow. a Changing laser polarization direction affects the detected SH signal intensity (cyan). The simultaneously recorded autofluorescence signal (AutoF, yellow), is not sensitive to laser polarization. b A spectral scan (9 nm wide detection channels) of the emission light in the backward detection path with a narrow peak at the frequency-doubled wavelength of the 850 nm incoming light (cyan peak, 425 nm). Autofluorescence (Yellow Gaussian fit, AutoF) was detected at longer wavelengths (n = 3 cells from three independent experiments). c SHG signals from in vitro polymerized fluorescently labeled microtubules without any other cellular components, indicating the true microtubular origin of the SH signals. d Recordings of neuronal cultures transfected with α-tubulin-eGFP (Yellow) show microtubular localization of the eGFP signal that colocalizes with SH-generating structures (Cyan). e SH signals recorded from colchicine (COL, 100 µM, 30 min) treated neurons were significantly decreased compared with untreated (CTRL, dimethyl sulfoxide (DMSO)) neuronal cultures (n = 27 cells from three independent experiments; ***p < 0.001 Unpaired two-tailed t-test). f SH signals are significantly reduced in nocodazole (50 nM, 4 h) compared to control (CTRL, DMSO) cells (n = 27 cells from three independent experiments; *p < 0.05 two-tailed Mann–Whitney test). g SH signals in neurons predominantly originate from the axonal microtubule network as indicated by immunofluorescence labeling for TAU (axon, red), MAP2 (dendrites, green), and HuCD (neuronal cell body, blue). h Shows three examples of SHG used to visualize microtubules in primary neuronal cell cultures derived from mouse midbrain, dorsal root ganglia and the enteric nervous system. i Maximum projection of the SH signals coming from microtubules in axonal processes of coronal acute hippocampal brain slices (250 µm thickness). SP: stratum pyramidale, SR: stratum radiatum. All cultures were imaged at 7 DIV apart from the enteric nervous system cultures at 3 DIV. Bar plots presented as means ± standard error of the mean. All source data are provided as a Source Data file

