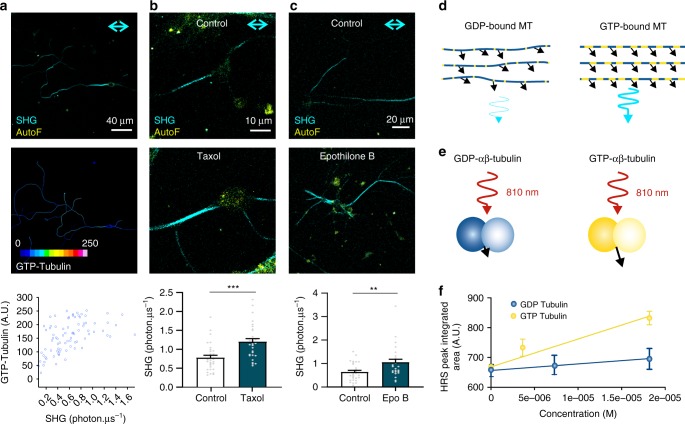
Fig. 5.
SH signals originate from the GTP-bound tubulin dimer conformation. a SH signals positively correlate with MB11 (GTP-bound tubulin conformation) staining intensity (n = 81 cells from three independent experiments; p < 0.001 Spearman r = 0.5642). b Increased SH signal intensities in untreated (DMSO) and taxol (10 nM, 4 h incubation)-treated hippocampal neurons (n = 27 cells from three independent experiments ***p < 0.001 two-tailed Mann–Whitney test) and HEK293T (n = 27 cells from three independent experiments; ***p < 0.001 Welch two-tailed t-test) cells. c SH signals were significantly increased upon addition of epothilone B (10 nM, 6 h) in neuronal cultures (n = 27 cells from three independent experiments; **p < 0.01 two-tailed Mann–Whitney test). d Schematic representation of how increased tubulin dimers in the GTP-bound conformation (yellow compared to blue GDP-bound tubulin conformation) could impact microtubule organization and SH signal intensity. The GTP-bound conformation leads to more rigid, less bendable microtubules, which in turn lead to a more parallel organization. e Because of the molecular alterations between GDP- and GTP-bound tubulin dimers, the dipolar hyperpolarisability tensor element βzzz (arrow) can be different, which directly affects SH signal intensities. Note that the arrows here represent the hyperpolarizability tensor element. f HRS shows a larger βzzz for GTP-bound tubulin dimers (βzzz = 190 ± 30 × 10−30 esu) compared to GDP-bound tubulin dimers (βzzz = 100 ± 10 × 10−30 esu), as calculated from the slope and intercept of the concentration dependency of the HRS peak amplitude. n = 10 measurements per concentration (mean ± standard deviation). Neuronal cultures were imaged at 7 DIV. Bar plots presented as means ± standard error of the mean. All source data are provided as a Source Data file

