Fig. 2.
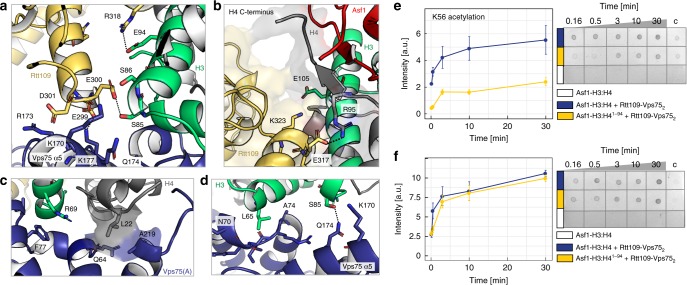
K9-acetylation does not depend on the H4 C-terminal region. a The interface of H3, Rtt109 and Vps75(A) displays a network of hydrogen bonds (dashed lines) and electrostatic contacts. b Interface between the H4 C-terminal region and Rtt109. c, d Interface of H3:H4 and Vps75(A): hydrophobic contacts involve H4-L22, H3-R69 and L65, Vps75-F77, Q64, A219 and the backbone of stretch 70–74; electrostatic contacts involve Vps75-K170 and Q174 and H3-S85. e, f Time-courses (left) of K56- and K9-acetylation quantified by dot-blot assays (right). The H4 95–102 stretch is important for K56ac (e) but not for K9ac (f). Experimental conditions: 0.2 μM Rtt109–Vps752, 0.2 μM Asf1−H3:H4, 2 μM Ac-CoA, 10 mM HEPES pH 8.0, 100 mM NaCl. Because the control reaction with 0.2 μM Asf1−H3:H4 (white) did not give signal above the background, an additional negative control with 6 μM Asf1−H3:H4 (column “c”) was used for normalization and comparison of the experimental repeats. The data were averaged over four experiments; the error bars are the standard errors of the means. Source data are provided as a Source Data file

