Fig. 1.
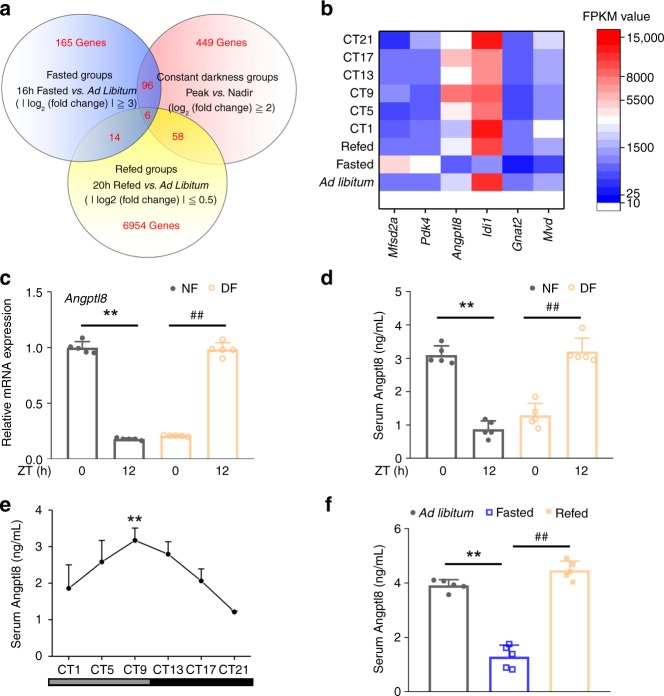
Angptl8 responses to food signals and peripheral clocks. a Venn diagrams of high-throughput RNA sequencing results from liver samples of mice subjected to 16-h fasting, 16-h fasting followed by 20-h refeeding, or DD. b Heat map of six clustered genes derived from high-throughput RNA sequencing results. c qPCR analyses of Angptl8 mRNA expression levels in the liver of mice subjected to time-restricted feeding. d Serum Angptl8 levels. For c, d n = 5, **P < 0.01 NF12 vs. NF0, ##P < 0.01 DF12 vs. DF0, one-way ANOVA followed by Bonferroni’s post hoc test. e Serum Angptl8 levels in mice subjected to DD. n = 5, **P < 0.01, Peak vs. Nadir, one-way ANOVA followed by Bonferroni’s post hoc test. f Serum Angptl8 levels in mice subjected to 16-h fasting or 16-h fasting, followed by 20-h refeeding. n = 5, **P < 0.01 16-h fasted vs. ad libitum, ##P < 0.01 16-h fasted vs. refed, one-way ANOVA followed by Bonferroni’s post hoc test. All data are presented as the means ± SD. Source data are provided as a Source Data file

