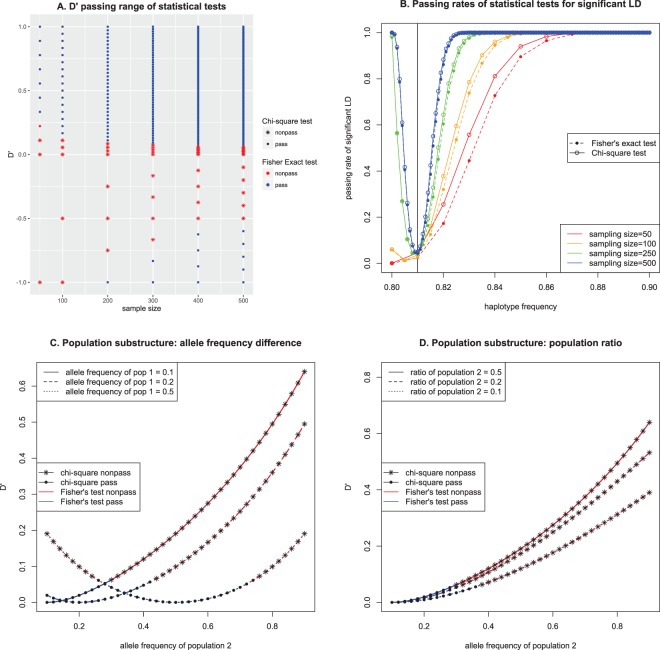
Figure 1.
Theoretical comparisons of LD between Fisher’s exact test and the chi-squared test (pass: significant p-values) when allele frequencies of both variants are 0.1: (A). Statistical test results depending on D′ and sample sizes depending on available haplotype frequencies; (B). Simulation results for various sample sizes for 10,000 times; (C). Impact of population substructure depending on the allele frequencies of equal-sized populations (both loci in a population have the same allele frequency); (D). Impact of population substructure depending on the ratios of the second population when the allele frequency of first region is 0.1 for both populations.

