Figure 7.
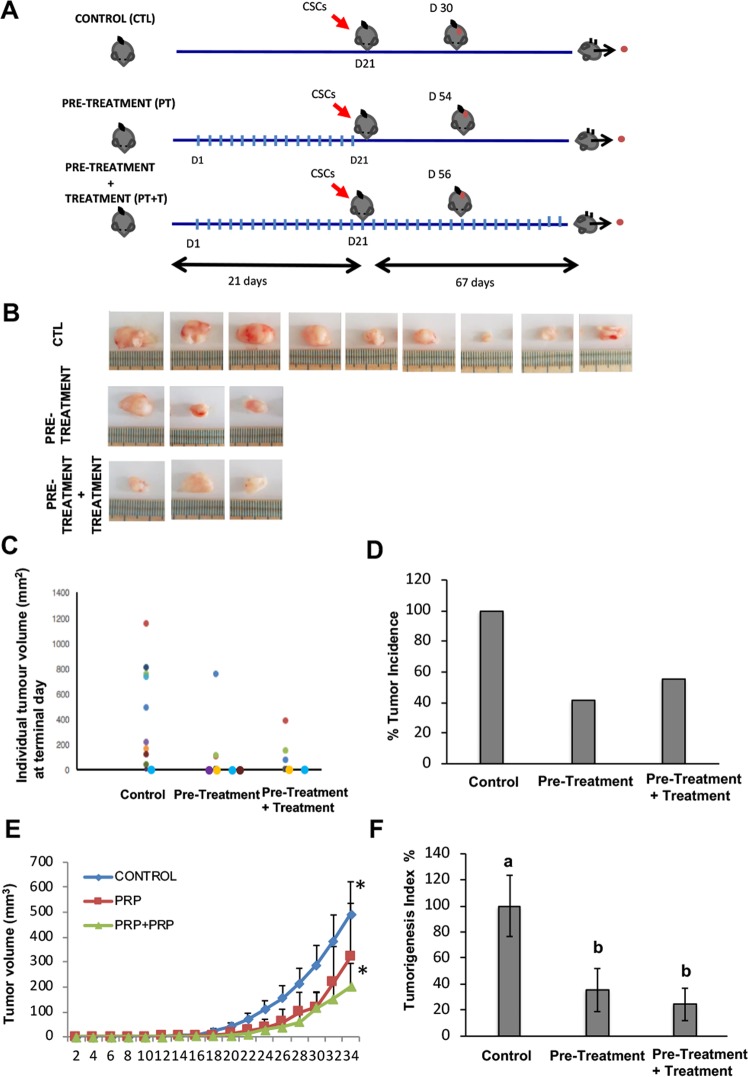
PRP reduced tumour growth of pancreatic CSCs in vivo. (A) Scheme of the in vivo study design to determine antitumour activity of PRP against pancreatic CSCs induced tumours. Perpendicular bars stand for PRP bolus injection. BxPC3 CSCs injection into the flank of nude mice is represented by a red arrow. (B) Photographs of the subcutaneous tumors isolated from mice included in the control and PRP treated groups at the end of the experimental protocol. (C) Tumour weight of each single tumour (different colour circles) at Termination (mg), mice with no tumour are represented by a colour circle on the X axis. (D) Tumour incidence. Percentage of mice with tumours respect to control group which represented a 100% of tumour incidence. (E) Tumour size evolution over time. MEM ± SE. *p < 0.05 vs. control group. (F) Tumorigenesis Index (TIn). This index relates tumour incidence and tumour weight. Percentage of mice with tumours respect to control group which represented a 100% of tumour incidence. Mean Tin ± SE at Termination. Different letters stand for significant differences (p < 0.05).

