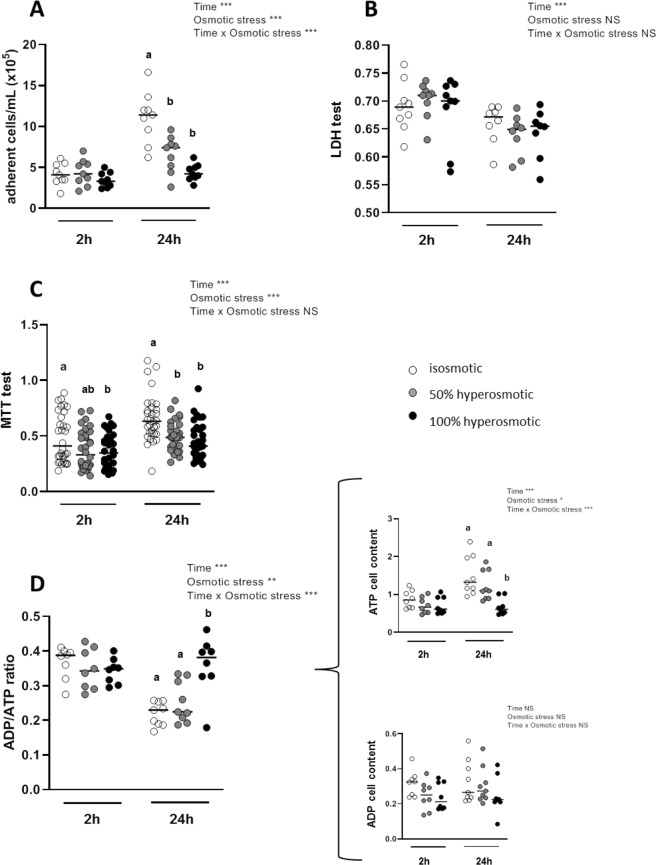
Figure 1.
Effects of apical hyperosmolarity on cell viability. Assays were performed after treatment during 2- or 24-h with hyperosmotic media or isosmotic control medium. (A) Number of adhering cells measured by cell counting. (B) Cell viability estimated by measuring LDH released in the medium before and after 1% triton treatment and expressed as ratio of alive and total cells. (C) Cell viability evaluated with MTT test, and (D) ADP/ATP cell ratio from the amount of ATP and ADP cell content (expressed as relative luminescence units in the curly bracket). In (A) and (B) experiments, cells were plated on 24-well plates and grown for 3 days before hyperosmotic stress assay. In (C) and (D) experiments, cells were plated on 96-well plates and grown 3 days before hyperosmotic stress assay. Values are from three to four independent experiments (n = 8–32 for each experimental group). Mean significant differences (P < 0.05) are indicated by a different letter. Main factor and interaction effects are indicated with *P < 0.05, **P < 0.01 and ***P < 0.001. NS: Non-significant difference.

