Figure 5.
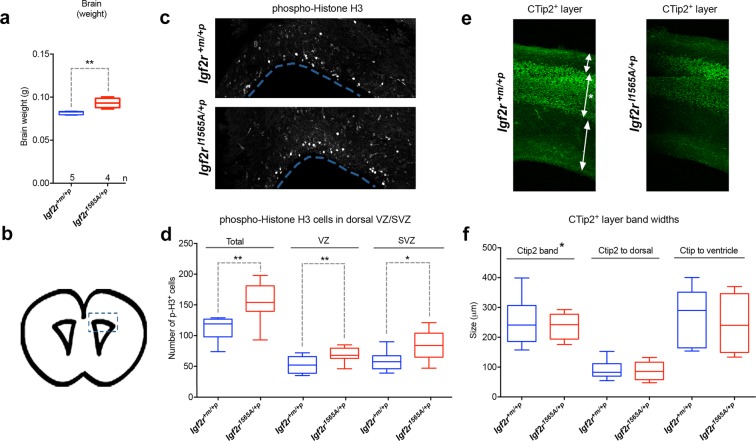
The effects of maternal transmission of Igf2rI1565A/+p on brain growth. (a) Brain weights at E18.5 are significantly increased in heterozygote Igf2rI1565A/+p compared to wild-type littermates (**p = 0.0079 Mann-Whitney test). (b) E18.5 mouse developing brain coronal image derived from the Allen Developing Mouse Brain Atlas (http://developingmouse.brain-map.org/experiment/siv?id=100054035&imageId=101103438&initImage=nissl). Box indicates the cerebral cortex region of the lateral ventricle in which the pH3 positive cell numbers in (c) were assessed. (c) Immuno-localisation in 50 µm coronal brain sections of phospho-histone H3 at E18.5 in wild-type and Igf2rI1565A/+p heterozygous littermates. (d) Quantification of pH3 positive cell numbers obtained from confocal images (z-stacks) of the ventricular zone (VZ), subventricular zone (SVZ) and in both of these regions (Total) from single brain sections of wild-type (n = 8) and Igf2rI1565A/+p (n = 9) littermates. Proliferation as judged by this biomarker was increased in both the VZ and SVZ in heterozygote Igf2rI1565A/+p compared to wild-type littermates (**Total p = 0.0025, **VZ p = 0.0084, *SVZ p = 0.0117, unpaired one-tailed t-test). (e) Immuno-localisation in 50 µm coronal brain sections of cortical layer marker, CTip2, at E18.5 in wild-type and Igf2rI1565A/+p heterozygous littermates. (g) Quantification of the relative size and position of the CTip2 positive band in wild-type (n = 8) and Igf2rI1565A/+p heterozygous (n = 9) littermates. (Non-significant; Ctip2 p = 3365, Ctip2 to dorsal p = 0.4040, Ctip2 to ventricle p = 0.5989, unpaired one-tailed t-test). Scale bars 100 µm. Box plots: horizontal line = mean, box 95% ± whiskers maximum and minimum.

