Fig. 1.
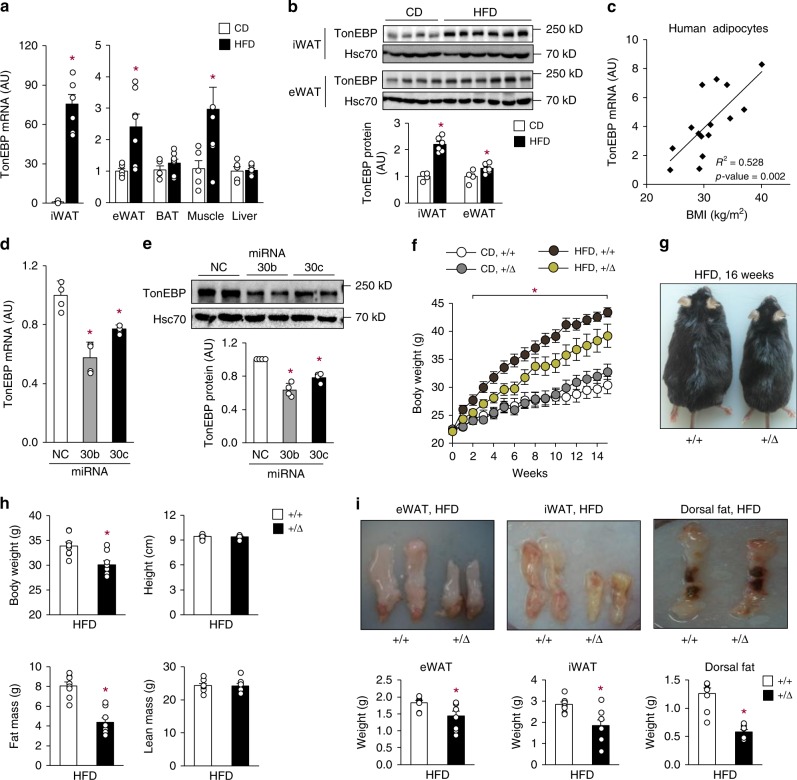
Adipocyte TonEBP expression is elevated in obesity and TonEBP-deficient mice resist obesity. a TonEBP mRNA levels in iWAT, eWAT, BAT, muscle, and liver from C57BL/6 J mice fed with CD (chow diet, n = 5) or HFD (high-fat diet, n = 7) for 16 weeks. b Immunoblots (top) and quantification of protein levels (bottom) of TonEBP and Hsc70 in iWAT and eWAT (CD, n = 4; HFD, n = 6). c Correlation of TONEBP mRNA levels in human subcutaneous adipocytes and BMI (n = 15). TonEBP mRNA (d) and representative immunoblots (e, top) and quantification of protein levels (e, bottom) in 3T3-L1 adipocytes transfected with miR-negative control (NC), miR-30b (30b), or miR-30c (30c) (n = 4). f–i TonEBP+/Δ mice ( + /Δ) and their TonEBP+/+ littermates (+/+) were fed with CD or HFD as indicated. f Changes in body weight after a switch to HFD (CD+/+, n = 7; CD + /Δ, n = 7; HFD+/+, n = 13; HFD+/Δ, n = 11). g Representative images of animals fed with HFD. h Body weight, height, fat mass, and lean mass (n = 8). i Representative images (top) and weight (bottom) of fat pads from HFD-fed animals (n = 4). n represents number of biologically independent samples (a–c, i) or animals (f–h) or independent experiments with triplicate (d, e). All data are presented as mean + s.e.m. (a, b, f, h, i) or + s.d. (d, e). AU, arbitrary unit. The p-values are determined by unpaired t-test (a,b, h, i) or one-way ANOVA (d–f). *p < 0.05 vs. CD (a), NC (d), or +/+ (f, h, i). Source data are provided as a Source Data file

