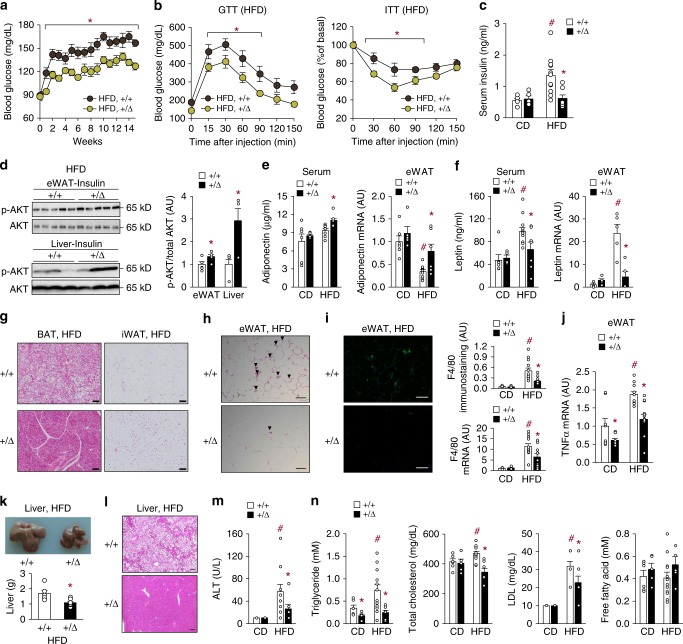
Fig. 3.
TonEBP deficiency ameliorates obesity-induced insulin resistance and metabolic dysfunction. a Changes in fasting blood glucose levels after a switch to HFD (+/+, n = 13; +/Δ, n = 11). b Glucose tolerance (left, n = 8) and insulin tolerance (right, n = 9) after 9 weeks on HFD. c–n Animals were analyzed after 16 weeks on HFD. c Circulating insulin concentrations (CD +/+, n = 5; CD +/Δ, n = 5; HFD +/+, n = 11; HFD +/Δ, n = 7). d Phosphorylation of AKT in eWAT (n = 5) and liver (n = 3) in response to insulin administration. e, f Serum concentration and mRNA abundance in eWAT of adiponectin (CD+ /+, n = 6; CD+ /Δ, n = 5; HFD+ /+, n = 9; HFD+ /Δ, n = 7) (e) and serum concentration (CD+ /+, n = 6; CD+ /Δ, n = 4; HFD+ /+, n = 12; HFD+/Δ, n = 7) and mRNA abundance (n = 5) in eWAT leptin (f). g Representative images of H&E-stained sections of BAT and iWAT. h Representative images of H&E-stained sections of eWAT. i Representative images of F4/80 immunostaining (left), quantitative analysis of F4/80 immunostaining (right, top), and F4/80 mRNA levels (right, bottom) of eWAT (CD, n = 8; HFD, n = 12). j TnFα mRNA levels in eWAT (CD, n = 8; HFD, n = 12). k Representative images (top) and liver weight (bottom) ( + / + , n = 6; + /Δ, n = 8). l Representative images of H&E-stained liver sections. ALT concentrations (CD, n = 5; HFD, n = 10) (m), and triglyceride, cholesterol (total and LDL), and free fatty acid levels (CD+ /+, n = 6; CD+/Δ, n = 5; HFD+/+, n = 12; HFD+ /Δ, n = 7) (n). n represents number of biologically independent samples. All data are presented as mean + s.e.m. Scale bars, 100 μm (g–i, l). AU arbitrary unit. The p-values are determined by unpaired t-test (d, k) or one-way ANOVA (a–c, e, f, l, j, m, n). #p < 0.05 vs. NC, *p < 0.05 vs.+/+. Source data are provided as a Source Data file

