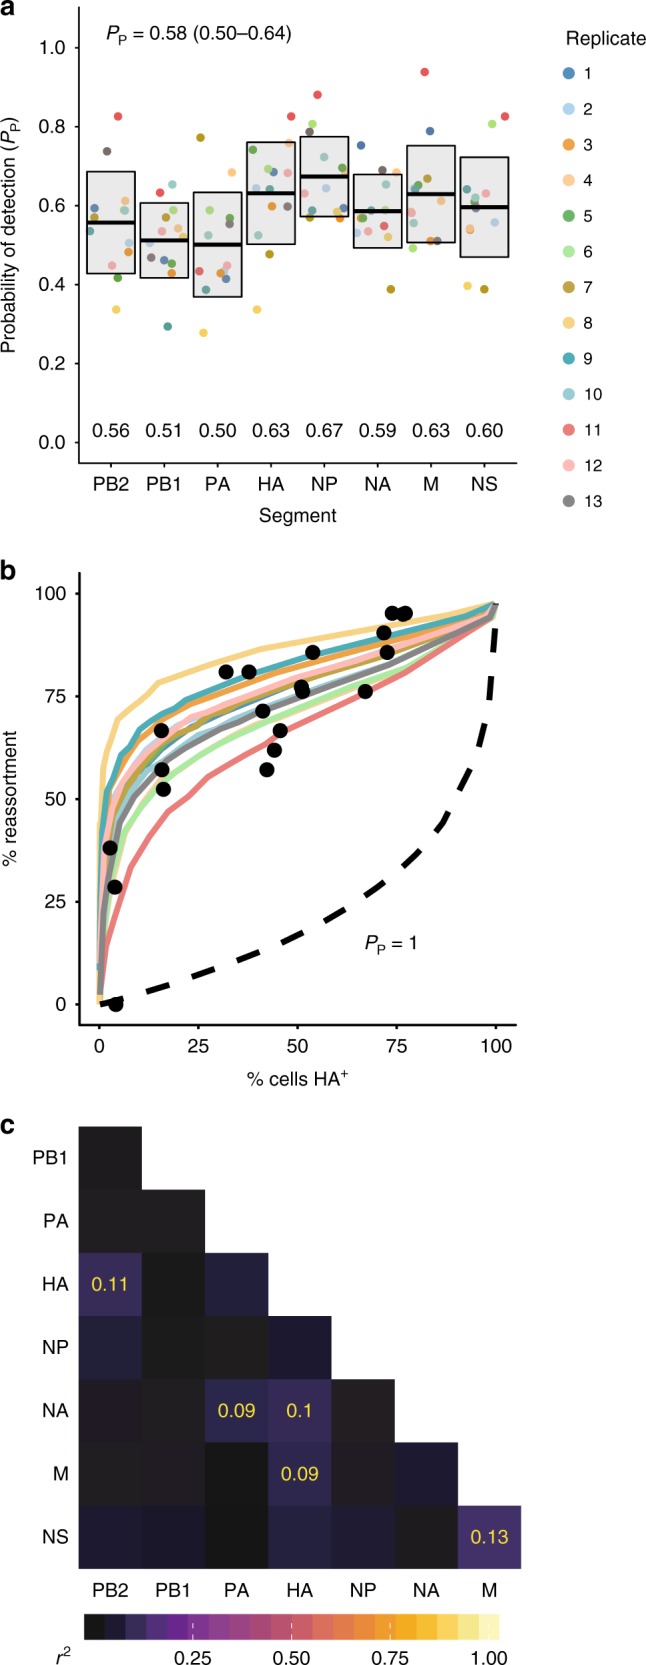
Fig. 1.

Incomplete genomes are common in Pan/99 virus infection. a Segment-specific PP,i values were measured by a single-cell sorting assay. Each set of colored points corresponds to eight PP,i values measured in a single experimental replicate, with 13 independent replicates performed. Horizontal bars indicate the mean (written above each segment’s name), and shading shows the mean ± SD (N = 13 independent experiments). b Using each replicate’s PP,i values as input parameters, the computational model from Fonville et al. was used to predict the frequency of reassortment across multiple levels of infection26. Black circles represent the experimental data from Fonville et al. and show levels of reassortment observed following single-cycle coinfection of MDCK cells with Pan/99-WT and a Pan/99 variant viruses. Colored lines show the theoretical predictions made by the model, with colors corresponding to the legend shown in panel a. c Pairwise correlations between segments (r2) are shown as color intensities represented by a color gradient (below). r2 values are shown in yellow for significant associations (Nr2 (where N is the sum of p(1 virion) values, N = 186) follows a χ2 distribution with three degrees of freedom, p < 0.05 (χ2 test) after Bonferroni correction for multiple comparisons). Source data are provided as a Source Data file
