Fig. 2.
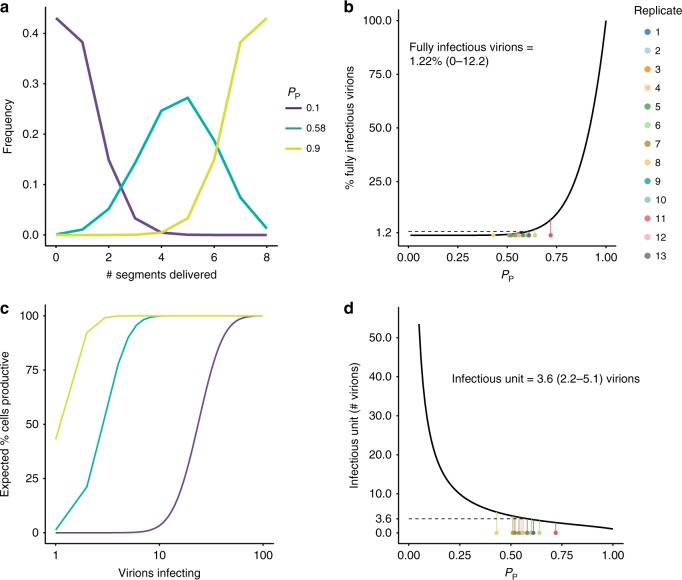
Incomplete genomes require complementation for productive infection at the cellular level. a The expected number of segments delivered upon infection with a single virion was calculated for two extreme values of PP (0.10, 0.90) and the estimated PP of Pan/99 virus (0.58, mean ± SD 0.50–0.64). b The percentage of virions expected to initiate productive infection was plotted as a function of PP. Colored points along the bottom of the plot correspond to the average PP value of each experimental replicate in Fig. 1, with lines connecting them to their predicted value on the theoretical line, and therefore represent predicted frequencies for Pan/99 virus. Mean ± SD (given by Eqs (8) and (9)) interval is given in the text above the line. c The percentage of cells expected to be productively infected following infection with a given number of virions was calculated for the same PP values as in (a). d The expected number of virions required to make a cell productively infected is plotted as a function of PP. As in (b), colored points correspond to the average PP value of each Pan/99 experimental replicate in Fig. 1, and mean ± SD (given by Eqs (13) and (14)) interval is given in the text. Source data are provided as a Source Data file

