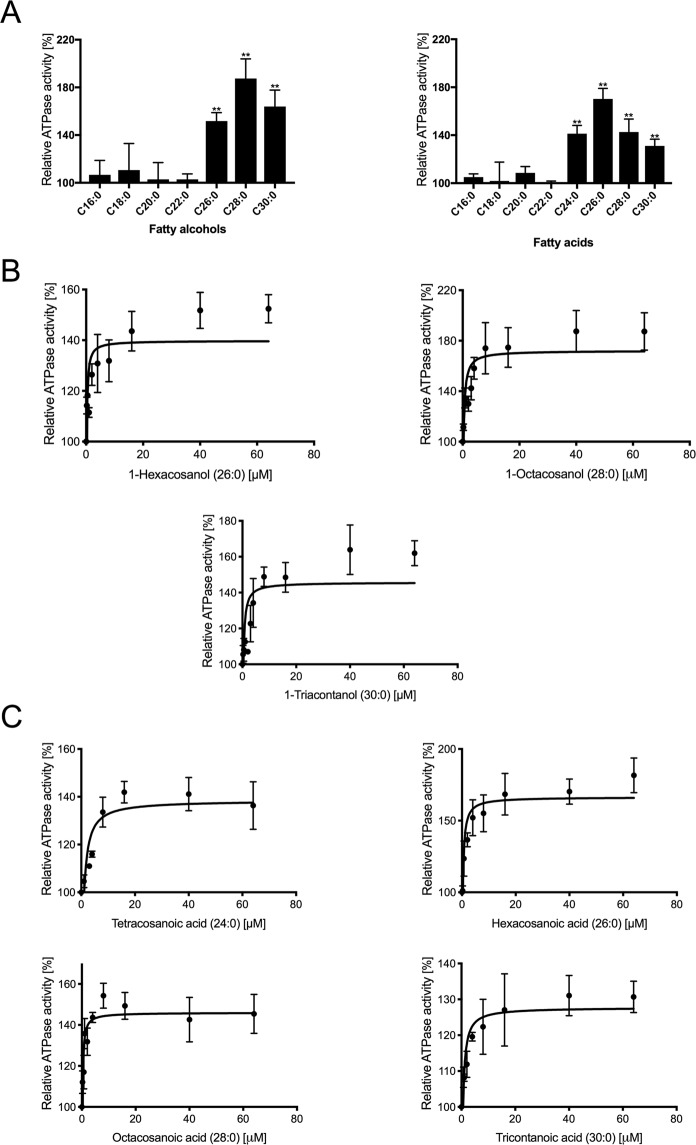
Figure 6.
Substrate stimulated AtABCG1 ATPase activity. (A) Relative ATPase activity of AtABCG1 in presence of 40 µM fatty acids and fatty alcohols (C16–C30). Significance analysis between basal activity and substrate stimulated ATPase activity was performed by t test. (two-tailed): ***P ≤ 0.0001, **P ≤ 0.01, *P ≤ 0.05. (B,C) Concentration dependent relative AtABCG1 activity in the presence of fatty acids (C24–C30) and fatty alcohols (C26–C30). The ATPase activity of the EQ/HA mutant was subtracted and data fitted according to Michaelis-Menten kinetics. Data represent mean and ±SD of at least three independent replicates. An ATPase activity of 100% corresponds to the basale activity of AtABCG1 in the absence of any substrate.

