
Fig. 2.
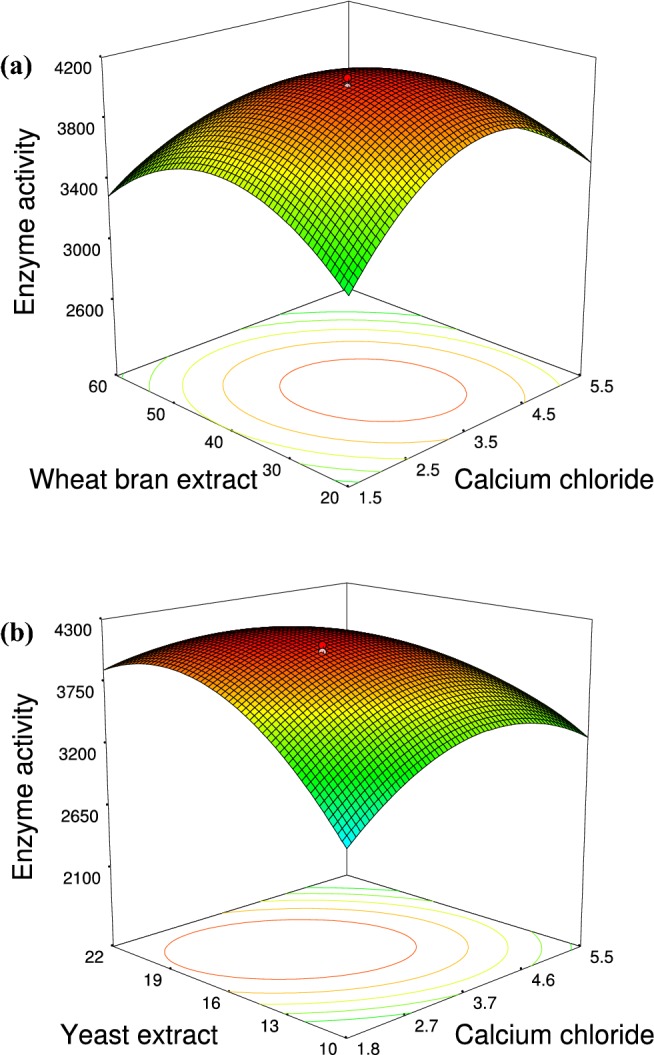
3D surface plots displaying the interactive effect of significant components optimized by response surface methodology (RSM). a WBE (wheat bran extract) vs. CaCl2 at fixed yeast extract level of 15 g/L. (b) Yeast extract vs. CaCl2 at fixed WBE level of 35 g/L