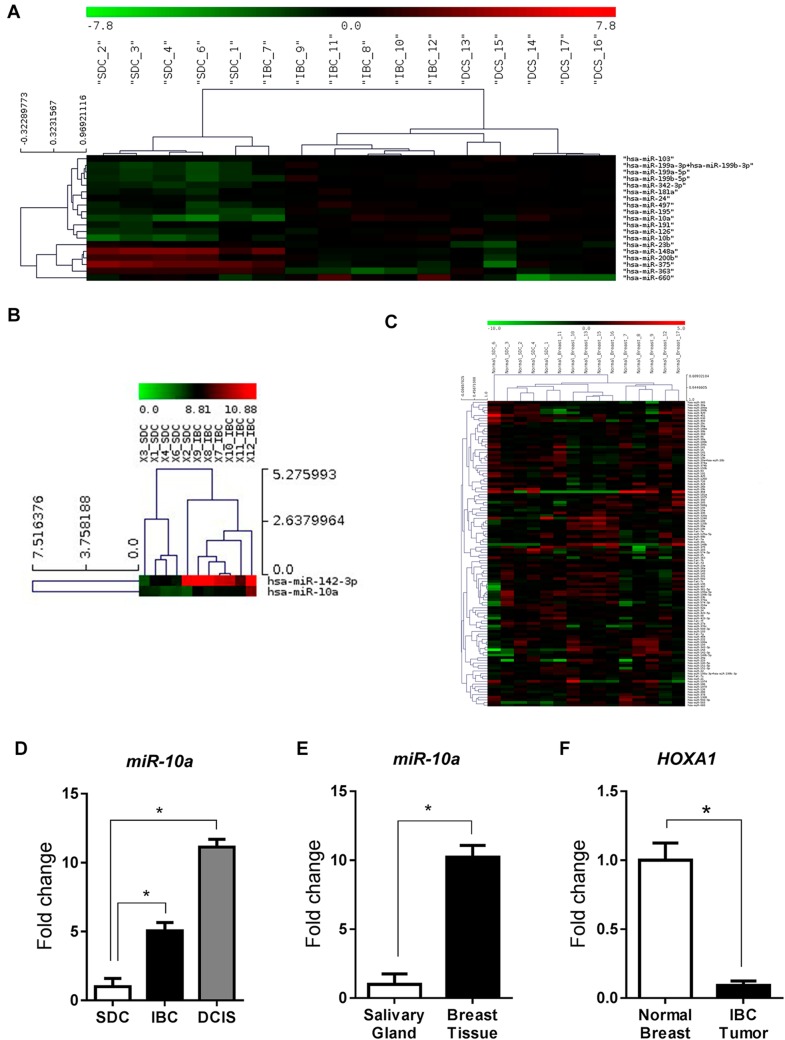
Fig. 3.
a Heat map showing the NanoString gene expression profiles of SDC, IBC and DCIS. b Heat map comparison between SDC and IBC showing expression of miR-142-3p and miR-10a. c Heat map showing miRNA profiles of normal salivary and normal breast tissues as determined by NanoString analysis. d Gene expression of miR-10a in SDC, IBC and DCIS as determined by RT-PCR. e Gene expression of miR-10a in normal salivary and normal breast tissue as determined by RT-PCR. fHOXA1 gene expression in IBC and normal breast tissue as determined by RT-PCR analysis, *p < 0.05

