Figure 1.

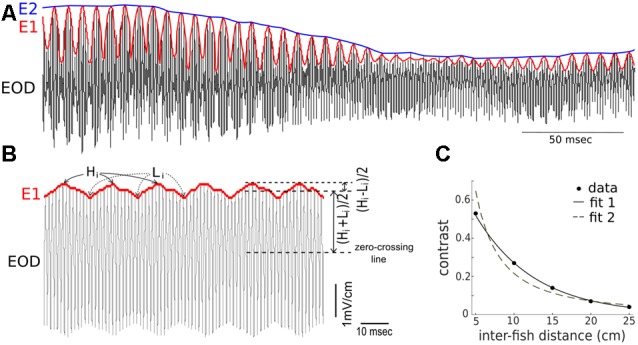
Summary of the terms used to describe the composite recorded electric signal produced during conspecific interactions. (A) Shown are depictions of the electric organ discharge (EOD; black), the first-order envelope (E1, red), and the second-order amplitude (E2, blue) in a signal recorded during an interaction of two fish (one restrained “Rfish” and one free-swimming “Ffish”). The frequency of the E1 modulation is a consequence of the difference in the EODf of the interacting fish. The magnitude of E2 is related to the distance separating the two fish, and E2 modulations result from changes in the position and orientation of the fish. (B) Instantaneous values of contrasts indicate the magnitude of E2 and are determined by calculating, over time, the size of the modulation depth relative to the amplitude of the recorded signal. The heights of the E1 peaks are denoted by H1, while the heights of the troughs are denoted by L1. “Contrast” = [(Hi − Li)/2]/[(Hi + Li)/2], and varies between 0 and 1. (C) When two fish are restrained oriented parallel to one another, an electrical recording sampled adjacent to the skin of one of the fish, shows the contrast increases as the distance between the fish decreases. The inverse relationship can be fitted as: contrast = 0.9977 e−(13.04* distance) with R2 = 0.9989 (fit 1). It can also be fitted, although slightly less well, by a power law as: contrast = 0.56 (distance)−1.586 with R2 = 0.9555 (fit 2). Note that the parameters in the fitting curve could take different values for another pair of fish.
