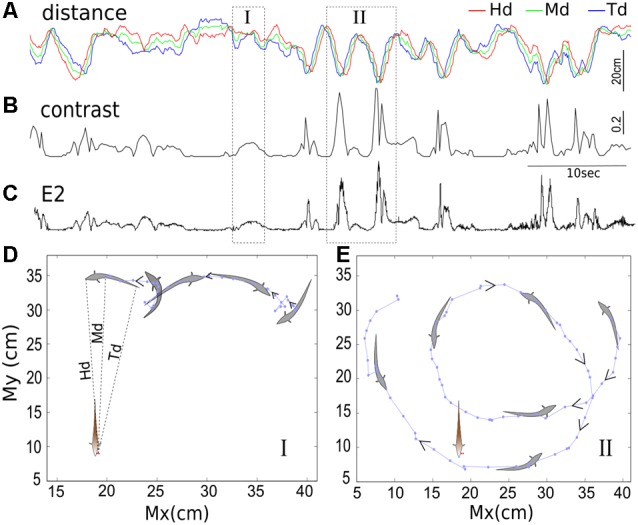
Figure 2.

The temporal relationships between inter-fish distances (A), contrast (B) and second envelope E2 (C). The distance separating the free-swimming fish and the recording electrodes positioned next to the operculum of the restrained fish are depicted in the top trace. The red, green and blue lines indicate the distance from the recording electrodes to the free-swimming fish’s head, middle of the body, and end of the tail, denoted by Hd, Md and Td, respectively. The instantaneous contrast and E2 calculated over time are shown in the second and third traces, respectively; both are inversely correlated with inter-fish distance. The position of the free-swimming fish in epochs indicated by boxes I and II are shown in (D,E; in 100 ms increments), with the arrows indicating the direction of movement over time. During epoch I, the fish swims backward towards the recording electrodes and then changes direction, and this results in a contrast bump. In epoch II, the fish swims backward, looping twice around the tank, passing close to the recording electrodes each time. These movements are evident in the distance minima and corresponding contrast peaks. Each point indicates the position of the middle of the fish’s body (Mx, My) measured at 100 ms increments.
