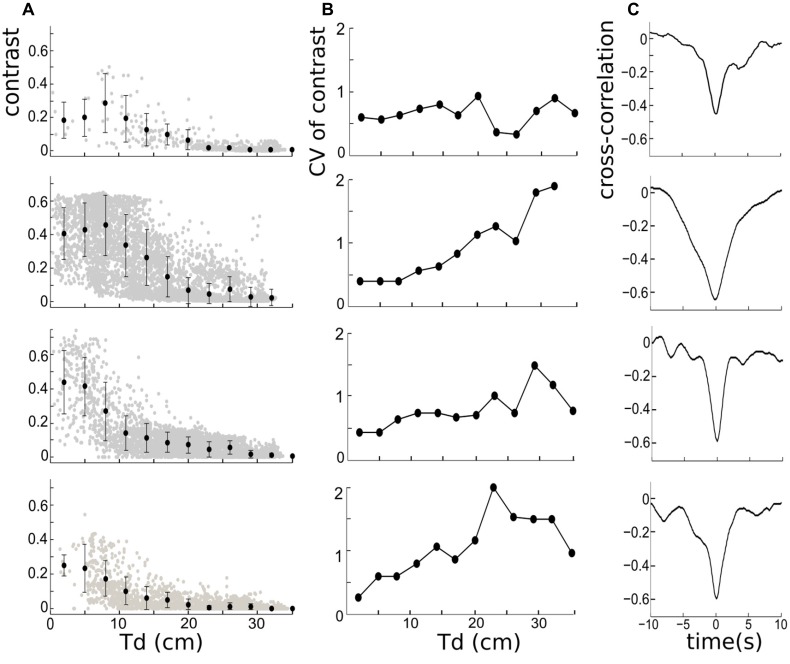
Figure 3.
(A) Left column: the negative relationship between instantaneous contrast and inter-fish distances measured from the tail of the free-swimming fish to the electrodes (Td), for four trials over 300 s. The errors bars on the mean contrasts correspond to ± 1 standard deviation, and reveal that the contrast variability is larger when mean distances are small. The mean contrast is calculated based on the bin-width of 10/3 cm. (B) Middle column: the corresponding coefficient of variation (CV) of contrast for four trials. The CV is largest at larger distances for three out of the four cases shown. (C) Right column: the cross-correlation functions depicting the relationship between contrast and Td. The significant negative correlation is present in all trials. The width of the trough and shape of the correlation vary across trials.

