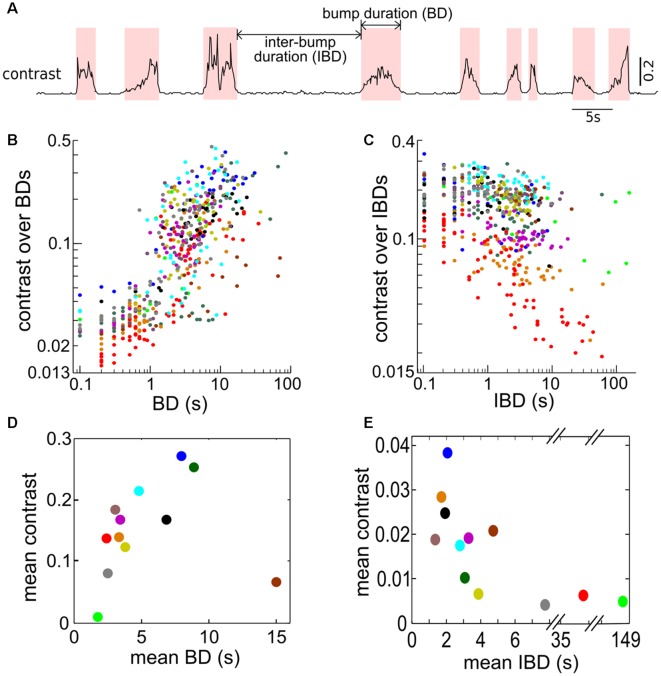
Figure 6.
Bumps in contrasts are associated with approach behaviors. (A) Trace showing instantaneous contrast calculated for one recording over 70 s demonstrating the occurrence of contrast bumps. Contrast bumps were defined as any time period in which the contrast remained above a value of 0.04 for two or more consecutive time bins (i.e., for 200 ms or longer). The contrast bump and inter-bump intervals are denoted as bump duration (BD) and inter-bump duration (IBD), respectively. (B) The average contrast calculated over each BD vs. the corresponding BD. (C) The average contrast calculated over each IBD vs. the corresponding IBD. (D) The relationship between the mean contrast calculated over all BDs plotted against the mean BD (in seconds). Each dot indicates one fish pair; 12 fish pairs are used. In general, longer BIs (i.e., longer duration when free-swimming fish is in the proximity of restrained fish) are associated with larger contrasts except the brown dot representing a fish pair where they kept a certain distance quietly most of the time. (E) The relationship between the mean contrast calculated during IBDs plotted against the mean IBD. For longer IBDs, the free-swimming fish tends to be further away from the restrained fish, resulting in lower contrasts. Panels (D,E) are color coded as (B,C) for each pair of fish.

