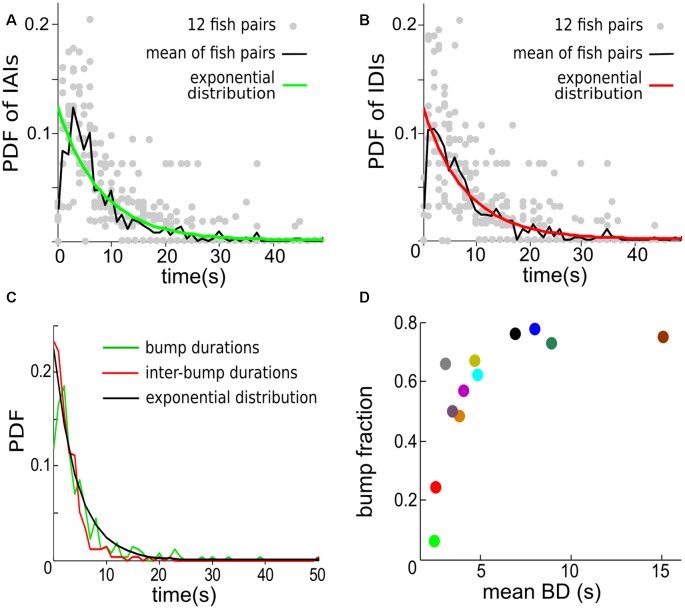
Figure 7.
The temporal distribution of contrast bumps across 12 individual fish pairs. (A) The probability density functions (PDFs) for individual trials (gray dots) and for the mean calculated across trials (green curve) of the intervals separating the start times of consecutive contrast bumps, i.e., inter-“arrival” intervals (IAIs). The mean IAI calculated over trials is 8.07 s. The PDF of an exponential distribution with mean rate λ equal to 8.07 s (black curve) is shown to fit well the observed mean IAI density. (B) The PDF for individual trials (gray dots) and for the mean calculated across trials (red curve) of the intervals separating the end times of consecutive contrast bumps, i.e., inter-departure intervals (IDIs). The mean IDI across trials is 8.18 s. The PDF of an exponential distribution with λ equal to 8.18 s (black curve) is again in good agreement with the observed mean IDI density. (C) The mean PDF of BDs and IBDs. The mean BD is 3.2 ± 0.7 s. An exponential distribution with λ equal to 4.44 s approximates the density of both BDs and IBDs. A bin width of 1 s is used for estimating the PDFs. (D) The bump fraction (fraction of time the contrast spends above chosen value of 0.04) vs. the mean BD for each fish pair. The data are color coded as in Figures 6D,E.

