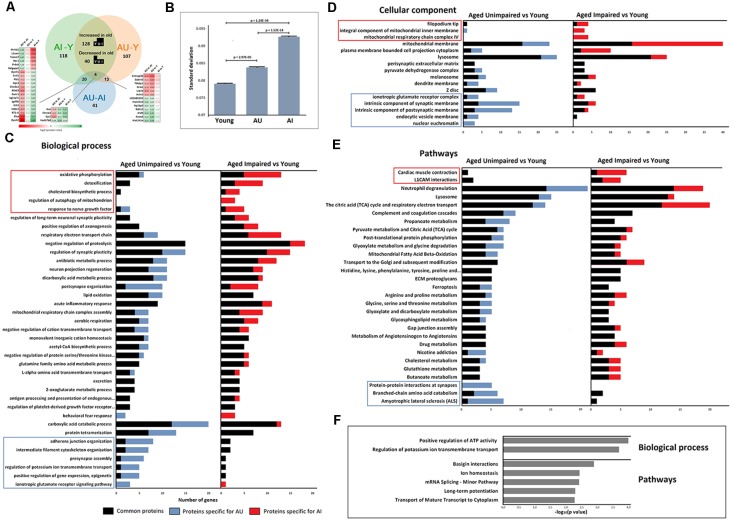
Figure 2.
(A) Venn diagram showing the relationship between AI vs. young, AU vs. young, and AU vs. AI significant proteins. (B) Analysis of variance (ANOVA) of protein levels revealed a significant increase in SD with age and with cognitive impairment (one-way ANOVA, t-test post hoc test). (C–E) Functional enrichment analysis was performed on the list of significantly changed proteins between young and two aging groups using ClueGO-Cytoscape platform (Benjamini–Hochberg P-values < 0.05). Displayed gene ontology (GO) terms are the most significant cases from significantly enriched clusters. GO terms in the frames were significantly enriched only in one group AU vs. young or AI vs. young. (F) Significantly enriched GO terms in the set of 77 proteins with different protein levels between AU and AI.

