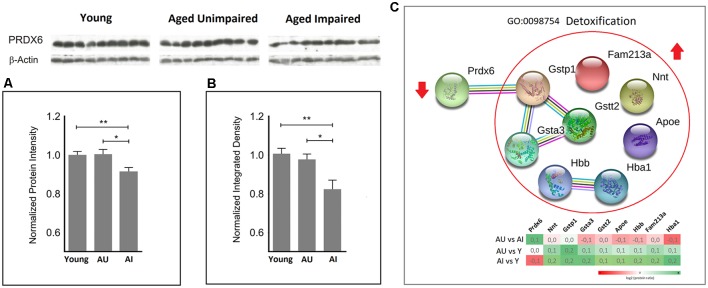
Figure 3.
Quantitative proteomic analysis (A) revealed significantly increased protein levels of peroxiredoxin 6 (PRDX6) in the AU vs. AI and young rats vs. AI (two-sided t-test). This finding was subsequently confirmed by immunoblot analysis (B). A normalized protein ratio is represented by group means of normalized protein intensities vs. young control and is expressed as mean ratio ± SEM (*p-value < 0.05; **p-value < 0.01; n = 9). (C) Representative GO term/cluster highlighted in enrichment analysis. Associated proteins are presented as association network using STRING 11. PRDX6 was the only protein in this cluster with decreased protein levels in AI compared to young and AU rats.

