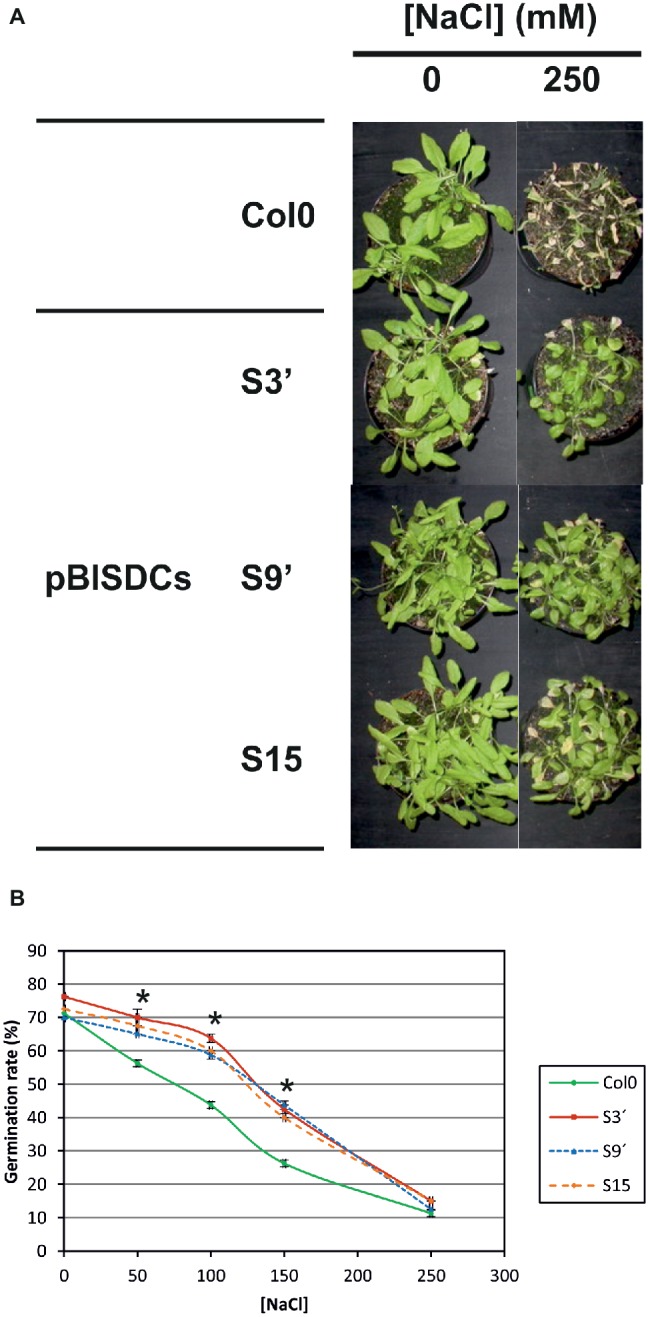
Figure 1.

Salt stress tolerance of pBISDCs lines. (A) Appearance of Arabidopsis WT and pBISDCs transgenic plants overexpressing SAMDC1 (S3′, S9 and S15) after 10 days of salt treatment. 3 week-old plants were watered with solution without (control) and with the supplementation of 250 mM NaCl. Pictures were taken after 10 days. (B) Seed germination percentage in MS plates supplemented with different concentrations of NaCl. The number of seeds that developed cotyledons until 8 days after stratification was counted. Graphs show the mean ± standard deviation from MS plate triplicates. Significant changes from control treatment are highlighted (*) (ANOVA, Tukey HSD test, p < 0.05).
