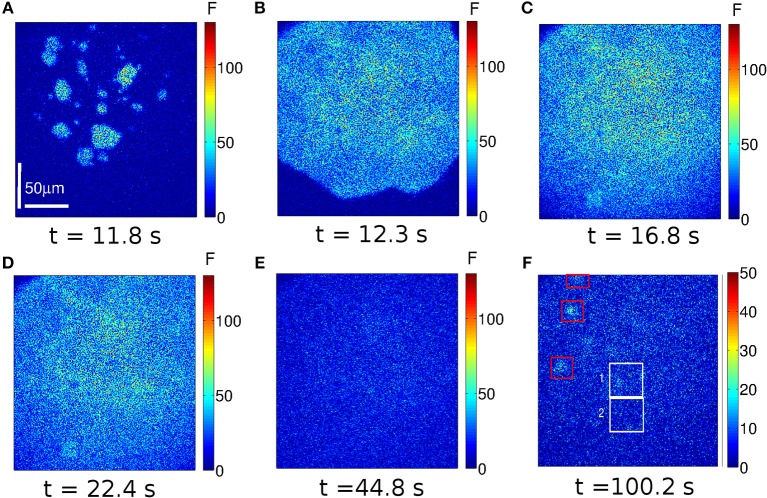
Figure 2.
Example of a Ca2+ signal evoked in an immature oocyte. Frames of 250 × 250 pixels acquired at the indicated times. Warmer colors correspond to increasing fluorescence values in arbitrary units (a.u.). The UV illumination (used to uncage the IP3) was on between t = 11.2 s and t = 28 s and between t = 173.6 s and t = 190.4 s. At t ~ 11.8 s various localized Ca2+ elevations (spotlights) are apparent (A). They eventually lead to a wave (B) that propagates throughout the observed region. The maximum fluorescence level is reached at t ~ 16.8s (C). A frame obtained slightly after shows a lower fluorescence level (D). After the (first) UV flash is turned off (t = 28 s) the fluorescence decays rapidly until it reaches the basal level by t = 44.8 s (E). Various localized signals (puffs) arise in between the two UV flashes as illustrated in (F). The white boxes indicate two regions analyzed in Figure 4.

