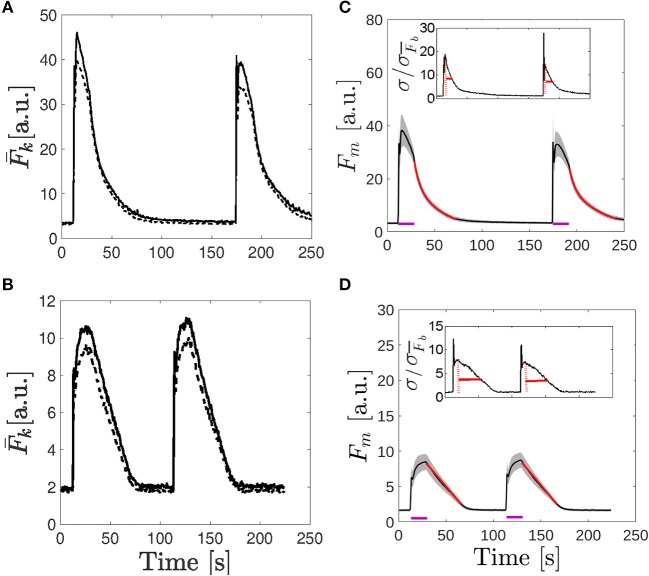
Figure 4.
Comparison of the fluorescence time course obtained in the examples of Figures 2, 3. (A,B) Time course of the fluorescence, , averaged over the two 50 × 50 pixel subregions depicted in Figure 2F (A) and Figure 3F (B). In both cases, the solid line corresponds to k = 1 and the dashed one to k = 2. (C,D) Mean fluorescence, Fm given by Equation (1) (black curve), and region around determined by the standard deviation, Fm ± σF with σF given by Equation (3) (shaded area) as functions of time for the immature oocyte (C) and for the egg (D). Fits to the traces after the UV flash was turned off are shown in red [bi-exponential fit given by Equation 4 in (C) and linear fit given by Equation 6 in (D)]. The purple lines indicate the times during which the UV pulses were on. In the insets the ratio, , with , the deviation before the first UV flash was delivered, is plotted. The maximum ratio is indicated with a dotted red line and the solid red line indicates the time it takes for the ratio to fall by half.

