
Figure 6.
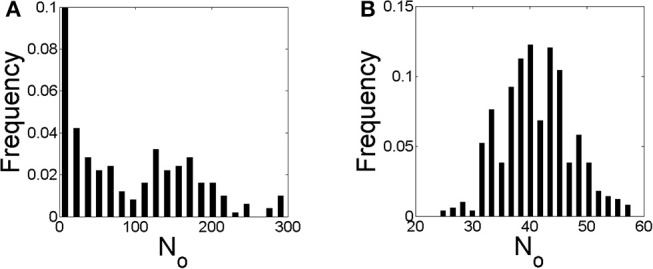
Distribution of the number of IP3Rs, No, that participate of a global Ca2+ release event derived from stochastic simulations of the model described in section 2.4 but with a mean separation between clusters of 4μm and (A) and (B), i.e., conditions S1 and S2 of Table 3, respectively.