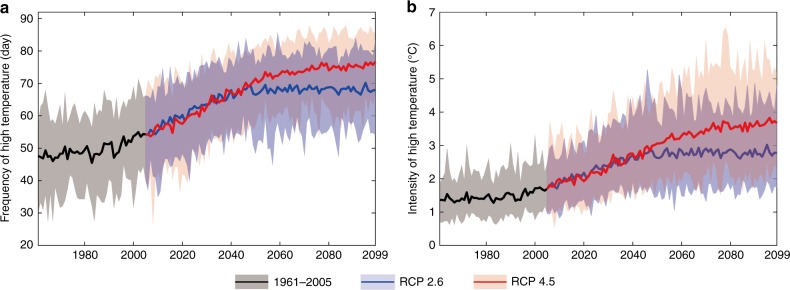
Fig. 1.
Frequency and intensity of high temperature in China metropolises for 1961–2099. Curves and shadows denote ensemble mean and range of 31 GCMs, respectively. Frequency (a) and intensity (b) of high temperature in China metropolises for the reference period 1961–2005 (gray) and for the future period 2005–2099 with RCP 2.6 (blue) and RCP 4.5 (red). Curves and shadows denote the ensemble mean and range of 31 GCMs, respectively. Source data are provided as a Source Data file

