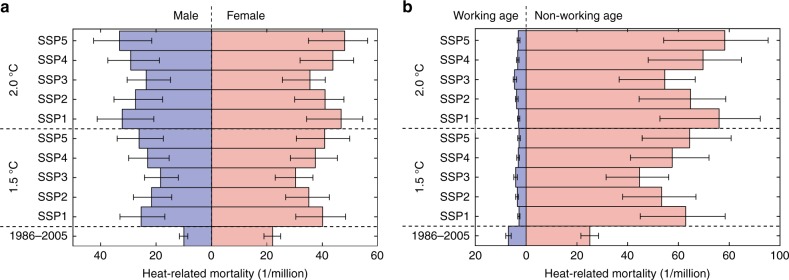
Fig. 3.
Comparison of annual gender and age-specific heat-related mortality at 1.5 °C and 2.0 °C global warming under SSPs and the reference period (1986–2005). Comparison of annual gender (a) and age (b) specific heat-related mortality at 1.5 °C and 2.0 °C global warming under SSPs and the reference period (1986–2005). Colored bars and black straight lines denote the ensemble mean and range of mortality estimated by multiple GCMs. Source data are provided as a Source Data file

