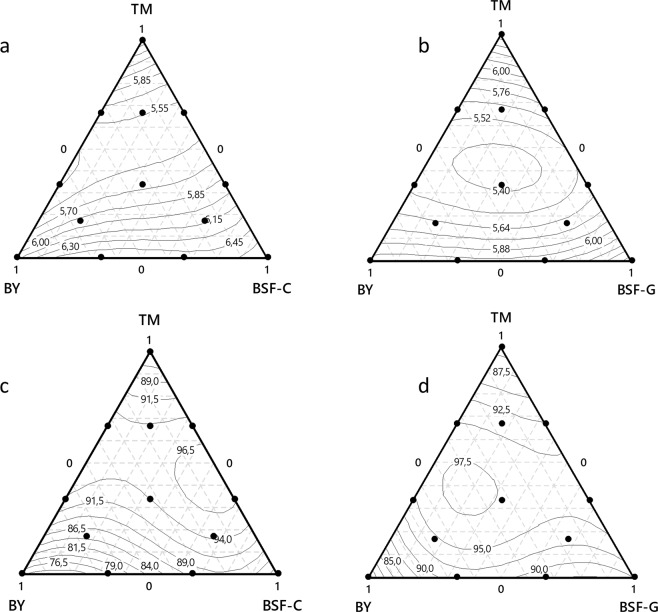
Figure 5.
Effects of diet mixtures with different mixture designs on Aedes aegypti larval development parameters. The top panels present the impact on larval development time from L1 to pupae in the mixtures TM, BY, BSF-C (a) and TM, BY, BSF-G (b). The bottom panels present the impact on larval survival rate from L1 to adults with the mixtures TM, BY, BSF-C (c) and TM, BY, BSF-G (d). In these plots, the response surface is viewed as a two-dimensional plane where all blends that have the same response are connected to produce contour lines of constant responses. TM: Tuna meal; BY: Brewer’s yeast; BSF-C: Black soldier fly corresponding to insect meal C; BSF-G: Black soldier fly corresponding to insect meal G.

