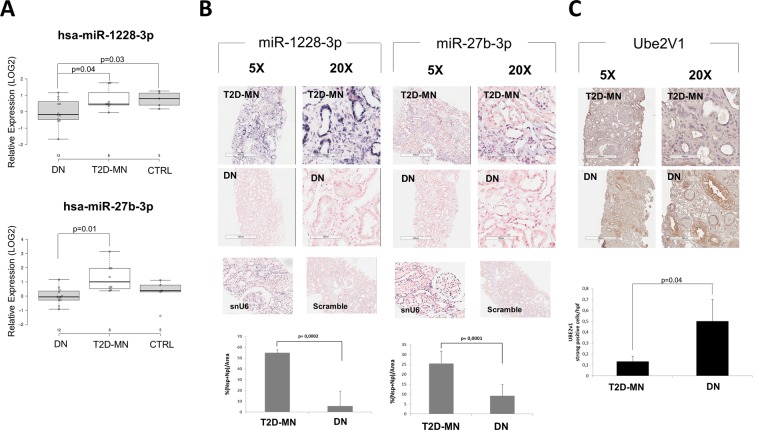
Figure 2.
miRNA 27b-3p and miRNA 1228-3p validation on kidney tissues. (A) qPCR of miRNA 1228-3p (upper panel) and miRNA 27b-3p (lower panel) expression levels on RNA extracted from kidney biopsies of 5 patients with normal kidney morphology (NK), 12 DN and 8 T2D-MN patients. Center lines show the medians; box limits indicate the 25th and 75th percentiles as determined by R software; whiskers extend 1.5 times the interquartile range from the 25th and 75th percentiles, outliers are represented by dots. (B) In situ Hybridization of miRNA 1228-3p and 27b-3p expression levels on kidney biopsies of DN and T2D-MN patients. snU6: small nuclear RNA U6 positive control. Scramble: DIG-labeled Scramble-miR probe negative control. ISH quantification was performed as described in methods. The histogram represents the mean ± SD. (C) Immunohistochemical analysis on kidney biopsies of patients with T2D and membranous nephropathy (MN) or diabetic nephropathy (DN).

