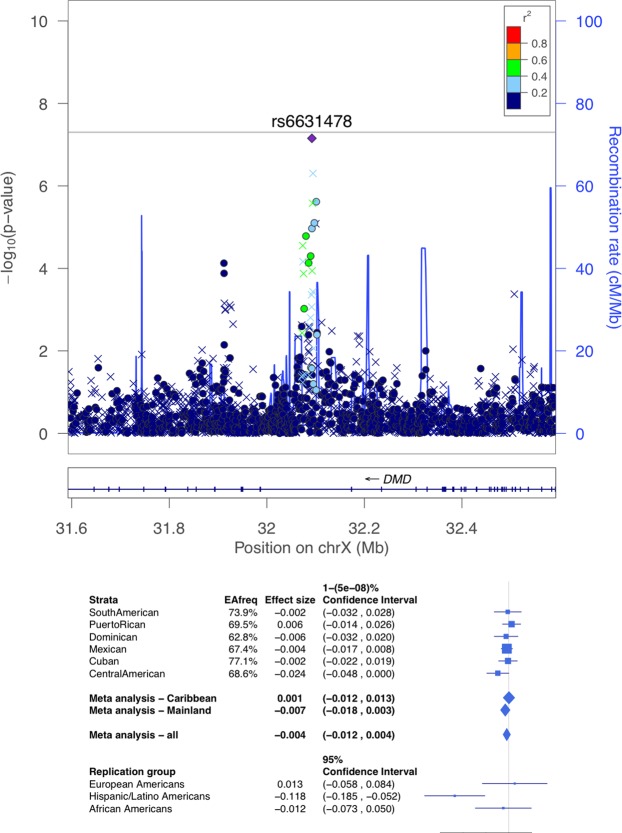
Figure 3.
LocusZoom plot (top) and forest plot (bottom) of the DMD locus, detected as suggestively associated with ABI in the Central American genetic analysis group. In the locusZoom plots, each point represents a variant, with location marked on the x-axis, and p-values marked as the location on the y-axis. The lead SNP is represented by the diamond, indicating that it is genotyped. The colors of the variants correspond to the strength of their LD (r2) with the lead SNP, with LD estimated using the Central American population of the HCHS/SOL. Circles correspond to genotyped variants, x symbols to imputed variants. The p-value of heterogeneity (across all HCHS/SOL genetic analysis groups) was 2.41 × 10⁻⁵. The bottom of the forest plot provides results from MESA replication groups.

