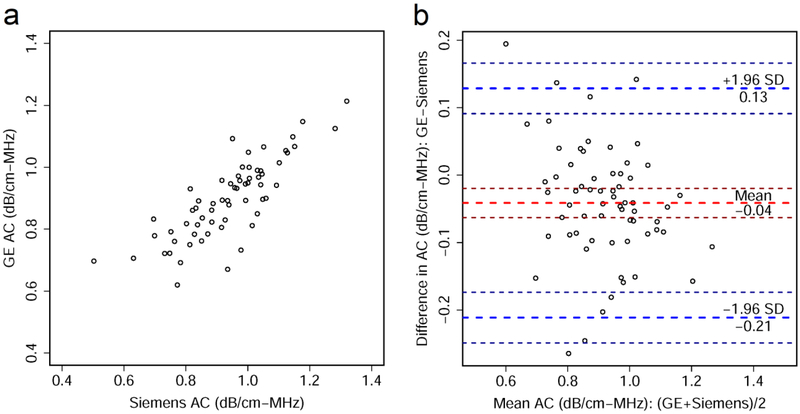
Figure 2.
(a) Scatter plot shows relationship between attenuation coefficient (AC) values measured from GE Logiq E9 and Siemens S3000. (b) Bland-Altman plot shows agreement between AC values measured using the two platforms. Thick red dashed line shows the mean difference in AC values between the two platforms and thick blue dashed lines demarcate ± 1.96 standard deviations (SD), with associated 95% confidence intervals indicated by thin dashed lines. The AC values in both plots were obtained by averaging five intra-platform repeated acquisitions per participant.

