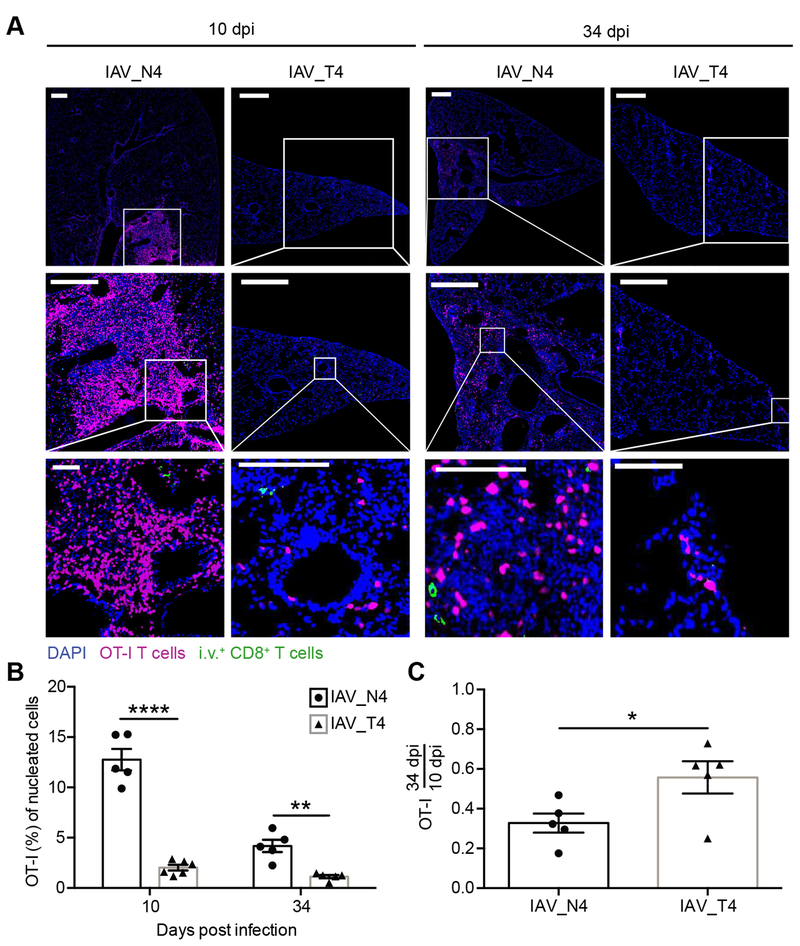
Figure 2. Confirmation of TRM formation by CD8+ T cells stimulated with high or low affinity peptides by microscopy.
Challenged mice were generated as in Figure 1. Tissue sections were stained for DAPI (blue), CD45.1 (magenta) and donkey anti-rat (green) to identify nucleated cells, OT-I T cells and iv+ cells, respectively. (A) Representative images of lungs from IAV_N4 or IAV_T4 epitopes at 10 or 34 dpi. White bars = 500 μm for top and middle rows, 100 μm for bottom row. (B) The percentage of OT-I T cells (CD45.1+) of nucleated cells (DAPI) in the lung from IAV_N4 or IAV_T4 infected mice. Each point represents a mouse, from two distinct lung sections, which were taken at least 100 μm apart. (C) The percentage of OT-I T cells in the lung at 34 dpi was divided by the average number of OT-I T cells in the lung at 10 dpi for each infection. The results (B, C) are compiled from 2 independent experiments with 2–3 mice per group, per experiment (± SEM). *p < 0.05, ** p < 0.01, **** p < 0.0001 (unpaired t test).

